
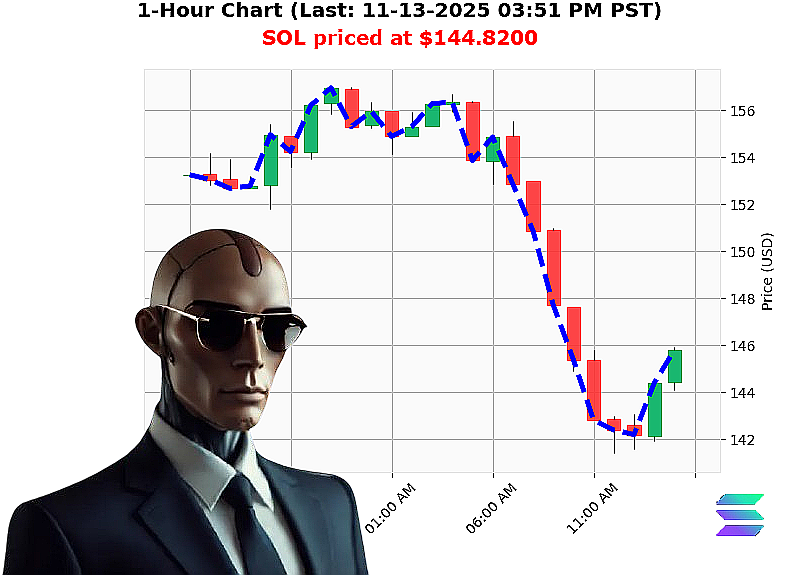
AUCTRON ANALYSIS for SOL-USDC at 11-13-2025 03:53 PM PST is to SHORT at $144.8200 confidence: 70% INTRADAY
SOL'USD Financial Summary ' Quantitative Analyst Report
1. Market'Cap & Flow Overview
- Market Cap Daily Total: -0.58 (down)
- OBV Daily Total: -26.72 (strong negative flow)
- Current Market Cap Rank: 6 (lowest relative to the asset's history)
- All'time High/Low: $293.31 / $0.500801
Interpretation:
The asset's market cap is contracting and the on'balance'volume indicates a net outflow of capital. These metrics are classic precursors to a weakening demand base and signal a bearish bias across all timeframes.
2. Price Structure & Momentum
- Current Price: $144.82 (just below the $145 floor)
- Week'to'Date Decline: -13.47'% from $167.37
- Month'to'Date Decline: -22.30'% from $186.38
- Year'to'Date Decline: -25.30'% from $193.87
- Higher Low Formation: From $141.53 ' $144.82 (+2.32'%)
- Fair'Value Gap: $145.79 ' $145.85 (down -0.71'%)
Interpretation:
SOL is riding a sustained downtrend with a recent higher low that is still above the $145 pivot. The fair'value gap indicates a subtle compression but the underlying trend remains bearish. The asset's price is currently trading above the market price by 0.67'%, a small but significant premium that may evaporate quickly.
3. Liquidity & Volume Profile
- Liquidity: 9.01'% (high)
- OBV Position: Strong short bias
- Volume'Profile Insight:
- The premium of 0.67'% suggests tight bid'ask spreads, yet the negative OBV implies that the volume is predominantly on the selling side.
- High liquidity provides a ready execution environment for scalping or intraday shorts but also raises the risk of rapid stop'loss triggers if a reversal occurs.
4. Key Drivers & Risk Factors
| Driver | Current State | Risk Factor |
|---|---|---|
| Market'Cap Momentum | Negative | Sustained outflow may force a break below key support ($140) |
| OBV Flow | Short'bias | Potential for sudden buying momentum from speculative positions |
| Liquidity | High | Sharp price moves could be absorbed quickly, tightening risk |
| Technical Pivot | $145 | A bounce above $145 could signal a short'term rally |
| Seasonal/Weekly | Down 13'% week'to'date | Momentum may be a reflection of broader crypto cycle |
| Macro Sentiment | Bearish | Regulatory or macro'economic events could accelerate decline |
5. Actionable Trade Insights
| Trade Type | Entry | Target | Stop | Rationale |
|---|---|---|---|---|
| Short (Intraday/Day) | $144.80 | $142.00 (near recent higher low) | $145.50 (slight buffer above current price) | 1. Entry aligns with the negative OBV and market'cap outflow. 2. Target captures a 2.8'% move to the lower support. 3. Stop protects against a quick rebound above the $145 pivot. |
| Scalp (Intraday) | $144.80 | $144.40 | $145.20 | 1. Short'swing move within the 0.67'% premium. 2. Rapid execution required given high liquidity. |
Execution Tips:
- Use a tight stop'loss to avoid slippage in a highly liquid environment.
- Monitor the OBV trend for any reversal signals; a shift to bullish OBV could warrant an immediate exit.
- Keep an eye on macro events; a sudden market rally can erode the short thesis.
6. Prediction & Confidence
| Decision | Trade Type | Prediction | Confidence Score |
|---|---|---|---|
| Short | Intraday/Day | SHORT | 70 |
Rationale: The confluence of negative market'cap momentum, strong short OBV, bearish price structure, and a slight premium above market price collectively support a short position. The score reflects solid conviction but acknowledges the possibility of a short'term bounce around the $145 level.
Call to Action
The market is primed for a bearish short opportunity on SOL'USD. Don't let the next dip slip through your fingers. Join our elite quantitative services today to harness real'time edge'building insights and secure consistent profitability.
#SOLShortStrategy #SOLBearishTrends