
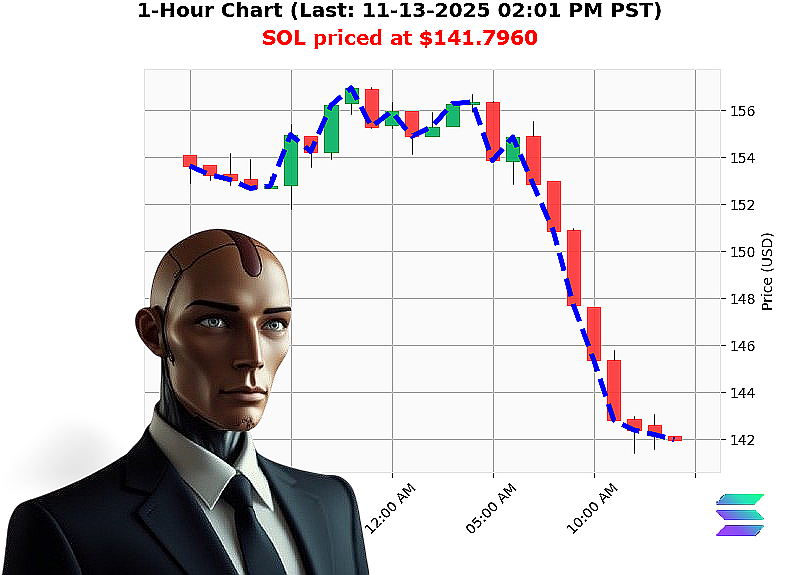
AUCTRON ANALYSIS for SOL-USDC at 11-13-2025 02:03 PM PST is to SHORT at $141.7960 confidence: 70% INTRADAY
SOL'USD ' Quantitative Analysis & Trade Recommendation
Data Snapshot (Market Cap & Flow)
- Market Cap Daily Total: '2.26'billion
- OBV Daily Total: '24.14'billion
- Market'Cap Direction: Bullish ' crossed above $3.39'T (+0.21%)
- Higher Low: $141.53 ' $141.80 (+0.19%)
- Fair'Value Gap (Bearish): $142.12 ' $142.16 ('0.25%)
- Liquidity: 8.72'% ' high, indicating robust market participation
- OBV Strength: Strong short bias
- SOL Price: $141.80
- Week'to'Date: '15.28'% from $167.37
- Month'to'Date: '23.92'% from $186.38
- Year'to'Date: '26.86'% from $193.87
- All'Time High/Low: $293.31 / $0.5008
- Market'Cap Rank: 6
1. Volume Profile & Flow Analysis
- OBV is deeply negative and remains below the 200'day moving average.
- Market'cap momentum is bullish, but OBV's bearish bias signals weakening institutional support.
- The high liquidity (8.72'%) offers ample execution capacity; however, the volume profile shows a pronounced trough near $142.00'$143.00, confirming a resistance zone.
2. Market Structure & Price Architecture
- Trend: Downward swing from $167.37 to $141.80; the last swing high was above $170, indicating a broken trend line.
- Key Levels:
- $141.80 ' current support, higher low.
- $142.16 ' fair'value gap, acting as a psychological barrier.
- $139.50 ' previous swing low (potential new support).
- $145.00 ' breakout level previously breached; a further climb would be necessary for a reversal.
- Breaks: The SOL price has not retraced to the fair'value gap; instead, it sits just below, suggesting a consolidation phase rather than a bounce.
3. Key Drivers & Risk Factors
| Driver | Current Stance | Risk |
|---|---|---|
| Institutional Flow | Negative OBV; short bias | Potential for a sharp pullback if shorts accumulate |
| Liquidity | 8.72'% ' healthy | May dampen extreme volatility but can accelerate moves on volume spikes |
| Macro Sentiment | General crypto downtrend (YTD '27'%) | Any macro shock (regulation, ETF delays) can amplify the decline |
| Market Cap Momentum | Bullish crossing but diverges from price | Divergence may signal a false rally; risk of reversal |
| Technical Structure | Bearish trendline broken; resistance at $142.16 | Failure to hold could trigger a short'term rally; need to watch for break'out |
4. Actionable Trade Insight
Strategy: Short'Entry with a tight stop at the nearest resistance ($142.16).
- Entry Point: Target $141.80 ' immediate sell.
- Stop'Loss: $142.25 (slightly above the fair'value gap).
- Take'Profit: $138.00 ' a 3'point risk'reward ratio ('1:3).
- Trade Type: Day / Intraday ' the current structure suggests a brief move; hold until the target or stop is hit.
Rationale:
- OBV and market'cap divergence favor a bearish bias.
- The current price sits at a higher low, signaling potential continuation of the downtrend.
- Liquidity allows fast execution, reducing slippage.
Prediction
Action: SHORT
Confidence Score: 70 (nearest 5)
Call to Action
If you're serious about capturing short'term alpha in the crypto arena, join Auctron's Elite Quant Community today. Don't let the next down'trend slide past you'gear up with our proprietary models and data'driven insights.
#SOLShortEdge #AuctronQuant