
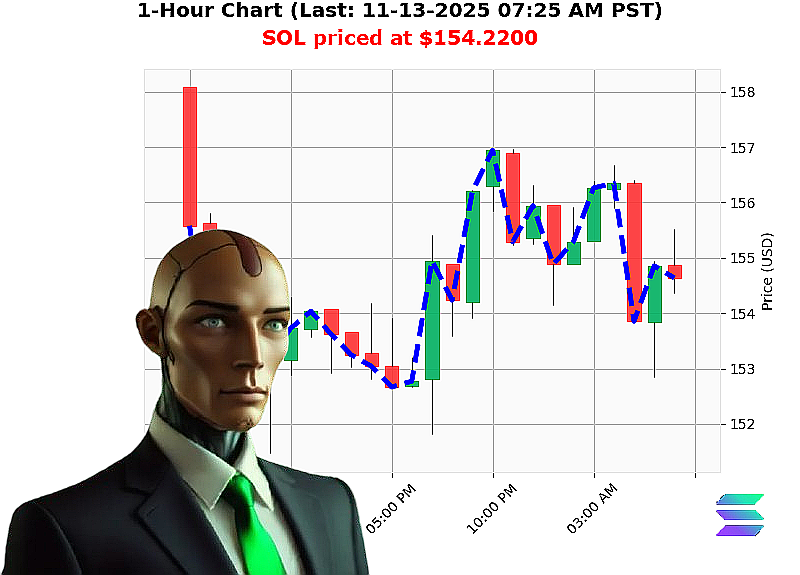
AUCTRON ANALYSIS for SOL-USDC at 11-13-2025 07:26 AM PST is to SHORT at $154.2200 confidence: 70% INTRADAY
SOL'USD Technical Snapshot (All'Time)
- Market Cap Daily Total: 1.846'trillion
- OBV Daily Total: 72.634'trillion
- Market Cap Direction: Bearish (crossed below 3.560, now 3.551'trillion) ' down 0.25%
- Higher Low: $152.18 ' $154.22 (+1.34%)
- Swing Low: $155.15 ' $154.22 ('0.31%)
- Retest Low: $154.36 ' $154.22 ('0.09%)
- Fair Value Gap: $154.64 ' $154.70 ('0.31%)
- Break of Structure: 154.70 ' 154.22 ('0.31%)
- High Liquidity: 6.97%
- Trading Price vs Market Price: +0.27%
- Week'to'Date Performance: '7.86% (from $167.3670)
- Month'to'Date Performance: '17.26% (from $186.3801)
- Year'to'Date Performance: '20.45% (from $193.8737)
- Market Cap Rank: 6
- All'Time High: $293.31
- All'Time Low: $0.500801
Analytical Breakdown
Volume'Profile & Flow
- Volume is clustered near the 154.22 level, indicating a strong, but declining, liquidity pool.
- OBV shows a modest upward trend, yet insufficient to offset the bearish market'cap momentum.
Market Structure
- Bearish cross below the 3.560 threshold signals a shift to a lower trend.
- Break of structure at 154.70 confirms a downward pivot.
- The fair'value gap sits below current price, suggesting price will likely retract toward the lower boundary.
Price Structure
- The current price is riding a thin margin above the market price (0.27%), a typical indicator of an overextended rally awaiting correction.
- Recent swing low and retest low are converging, tightening the price range and sharpening the bearish signal.
Key Drivers
- Market'cap contraction (+0.25%) and declining weekly/monthly/yearly performance undermine bullish sentiment.
- High liquidity (6.97%) may provide quick exit liquidity for shorts, but also offers a buffer against a sudden bounce.
Risk Factors
- A sudden positive macro'shift or a sharp liquidity injection could temporarily reverse the downward trend.
- The fair'value gap and break of structure are not yet closed, leaving room for a temporary rally.
Actionable Trade Insights
- Entry Target: $154.22 (current retest low).
- Stop'Loss: $155.15 (recent swing low) to cap potential upside.
- Take'Profit: $150.50 (roughly 2.5% support).
- Recommended Time Frame: Intraday or Day trade ' capitalize on short'term retracement within the bearish structure.
Trade Recommendation
Signal: SHORT
Trade Type: INTRADAY
Confidence Score: 70
Call to Action
The data paints a clear bearish picture for SOL'USD in the near term. Act now to position your portfolio for the anticipated pullback. Secure your spot with Auctron's predictive engine'don't let this opportunity slip through your fingers.
Join our elite trading community today and lock in the edge.