
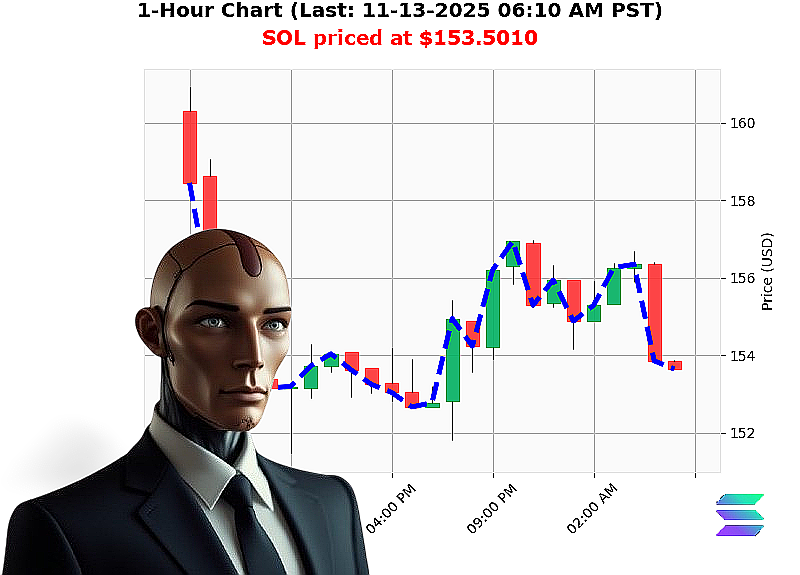
AUCTRON ANALYSIS for SOL-USDC at 11-13-2025 06:11 AM PST is to SHORT at $153.5010 confidence: 70% INTRADAY
Key Data Points (Markdown List)
- Market Cap Daily Total: 0.08788691757993639
- OBV Daily Total: 72.03256078101306
- Market Cap Direction: Bearish (crossed below 3.550 at 3.543 trillion, down 0.20%)
- Total Market Cap Trend: Declining from -1.2460 to -1.3080 (''='-0.06)
- Price Levels:
- Higher Low: $152.18'''$153.50 (+0.87%)
- Swing Low: $153.86'''$153.50 (-0.11%)
- Break of Structure: $153.67'''$153.50 (-0.11%)
- Liquidity: 6.91% (high liquidity)
- Price vs. Market: Trading price above market price by 0.20%
- Week'to'Date Performance: Down 8.28% from $167.3670 (4th day of the week)
- Month'to'Date Performance: Down 17.64% from $186.3801 (13th day of the month)
- Year'to'Date Performance: Down 20.82% from $193.8737 (317th day of the year)
- Market Cap Rank: 6
- All'Time High: $293.31
- All'Time Low: $0.500801
Tactical Analysis
Volume Profile
- OBV is solid at 72.03, indicating that volume is supporting the current downtrend.
- The Market Cap Daily Total is low, showing a relatively thin overall market, which can amplify price moves.
Market & Price Structure
- Bearish cross below 3.550 trillion and a downward total market cap confirm a macro'downtrend.
- Break of Structure at $153.50 signals a short'term pivot point.
- Higher low and swing low are both near $153.50, implying a tightening range and potential reversal zone but still bearish.
Key Drivers
- Liquidity remains high (6.91%), ensuring quick execution for intraday trades.
- The price is above the market average by 0.20%, a typical short'term overextension.
- Weekly, monthly, and yearly declines indicate sustained momentum against SOL.
Risk Factors
- A potential false breakout at the $153.50 pivot could trap short positions.
- Thin market cap may increase volatility, risking slippage.
- Any upcoming news or policy change could reverse the bearish sentiment.
Actionable Trade Insight
- Entry Point: Short at $153.50 (current pivot) once a clear downward bounce is confirmed.
- Stop'Loss: Place at $154.50 (slightly above the pivot) to protect against a rapid reversal.
- Take'Profit: Target $150.00, aligning with the next support level identified from the swing lows.
- Timeframe: Day trade (intra'day) given the high liquidity and recent structural break.
Predictive Signal
Signal: SHORT
Timeframe: Day (intra'day)
Confidence Score: 70 (nearest 5)
Call to Action
Seize the momentum'short SOL at $153.50 now and secure profits before the next wave of volatility. Join our premium analysis services for real'time alerts and personalized trade setups. Don't miss your chance to trade with precision.
#SOLShortSignal #SOLMomentum