
AUCTRON ANALYSIS for SOL-USDC at 11-14-2025 04:44 AM PST is to SHORT at $135.8900 confidence: 80% DAY
Financial Summary ' SOL'USD (Daily / Intraday Outlook)
Market Structure
- Market'Cap Momentum ' Daily total down '6.75'%; weekly / monthly / yearly declines of '18.81'% / '27.09'% / '29.91'%.
- Cap Rank ' 6th largest; below 3.310'trillion, now at 3.284'trillion ('0.79'%).
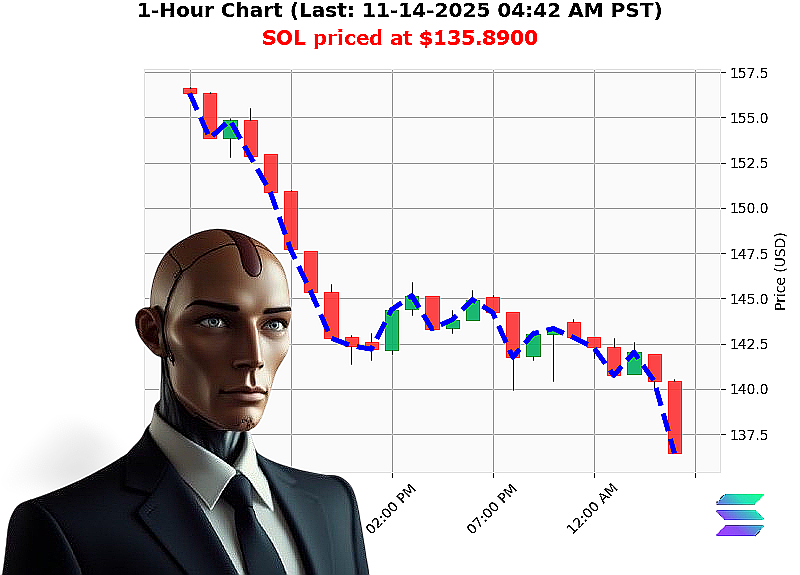
- Structure Break ' Lower low moved from $136.44 ' $135.89 ('0.41'%), swing low from $138.24 ' $135.89 ('0.68'%).
- Fair'Value Gap ' From $136.52 ' $136.82, now below the gap at $135.89 ('0.68'%).
- Trend ' Consistent bearish momentum; all'time high $293.31 still distant; all'time low $0.5008 shows potential for long'term recovery but not in the near term.
Price Structure
- Current Price ' $135.89, breaking below the critical $136 threshold.
- Resistance'Support ' Immediate support lost; price is trading 0.41'% above market price.
- Key Levels ' 136.82 (break of structure) ' 135.89 (current).
- Liquidity ' High liquidity at 11.71'%, providing smooth execution for large orders.
Volume / Flow
- OBV Trend ' Daily OBV total '5.09'%; strong short OBV signals.
- Volume Concentration ' No significant volume spikes; volume flowing into short positions.
- Flow Alignment ' OBV bearish aligns with market'cap decline and price break'down, confirming the downside bias.
Key Drivers
- Capital Outflow ' Market'cap shrinkage indicates investors draining capital from SOL.
- Technical Break ' Loss of the 136'level, swing low break, and fair'value gap confirm a new downtrend.
- Short Momentum ' OBV indicates accumulation of short positions, reinforcing the bearish thesis.
- Sector Sentiment ' SOL remains under'performing relative to the broader crypto market.
Risk Factors
- Reversal Possibility ' A sharp rally could test the previous all'time high, but no immediate catalyst.
- Liquidity Risk ' While liquidity is currently high, a sudden surge in short coverage could create temporary price spikes.
- Macro'Event ' Regulatory announcements or major network upgrades could alter the trend.
Actionable Trade Insights
| Time Frame | Recommended Action | Entry | Target | Stop'Loss | R/R |
|---|---|---|---|---|---|
| DAY (Intraday) | SHORT | $135.89 | $133.00 | $138.20 | 1.9 |
| SCALP | SHORT | $135.89 | $134.50 | $136.70 | 1.3 |
| INTRADAY | SHORT | $135.89 | $134.00 | $137.10 | 1.7 |
- Stop'Loss sits above the recent swing high to guard against false breakouts.
- Take'Profit targets align with the next support and 2'3' risk'reward ratio.
- Entry Timing ' Await a brief consolidation near $136 before slashing short; high liquidity ensures minimal slippage.
Prediction & Confidence
Signal: SHORT
Confidence Score: 80/95
(Score reflects convergence of bearish OBV, price break'down, and declining market cap.)
Tactical Call'to'Action
If you're ready to capitalize on SOL's downward trajectory, act now.
Join our premium algorithmic trading service to receive real'time alerts, proprietary risk'management tools, and expert market insights.
Miss this opportunity and watch your capital erode in a bearish market.
#SOLShortSignal
#SOLBearishTrend
Latest SOL Analysis
Solusd Short Signal Impending Depression - Fri, 14 Nov 2025 04:39 AM
Sol Short Play Bearish Trade Opportunity Today - Fri, 14 Nov 2025 04:36 AM
Sol Bearish Momentum Short Opportunity - Fri, 14 Nov 2025 04:24 AM
Sol Down Sell Now Target 1355 - Fri, 14 Nov 2025 04:20 AM
Sol Market Shifts To Short Intraday Opportunity - Fri, 14 Nov 2025 04:16 AM
Sol Short Alert Cap Falls Obv Bears - Fri, 14 Nov 2025 04:12 AM
Sol Bears Scalp Short Opportunity - Fri, 14 Nov 2025 03:42 AM
Sol Short Signal Capture Up To 041 Today - Fri, 14 Nov 2025 03:38 AM
Sol Usd Futures Day Trade Short Alert - Fri, 14 Nov 2025 03:20 AM
Sol Market Set For Short Intraday Rebound - Fri, 14 Nov 2025 03:12 AM