
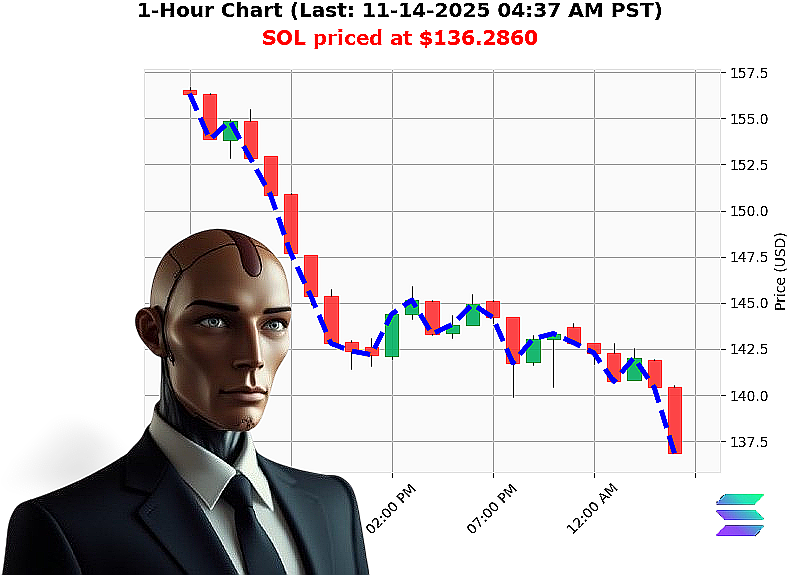
AUCTRON ANALYSIS for SOL-USDC at 11-14-2025 04:39 AM PST is to SHORT at $136.2860 confidence: 85% INTRADAY
SOL'USD ' Tactical Analysis & Trade Recommendation
Key Data Snapshot (Markdown List)
- Market Cap & Volume Indicators
- Market Cap Daily Total: '5.96
- OBV Daily Total: '4.87
- Market Cap Direction: Bearish ' crossed below $3.32'trn ('0.18%)
- Lower Low: $136.85 ' $136.29 ('0.41%)
- Swing Low: $138.72 ' $136.29 ('1.41%)
- Fair'Value Gap: $138.05 ' $138.24 ('1.41%)
- Break of Structure: $138.24 ' $136.29 ('1.41%)
- High Liquidity: 11.82'%
-
Trading price above Market price by 0.41'%
-
Short'Term Performance
- SOL at $136.2860 down 18.57'% YTD '29.70'%
- Week'to'date: '26.88'% (14th day of month)
-
Current day: 5th of the trading week
-
Historical Benchmarks
- Rank: 6
- All'Time High: $293.31
- All'Time Low: $0.500801
Market Structure Assessment
- Price Structure:
- Persistent downward swing, breaking key support at $138.24.
- Current price sits at a new swing low of $136.29, signaling a potential continuation of a bearish trend.
-
Absence of bullish reversal patterns; no high'volume retest of prior highs.
-
Volume Structure:
- OBV consistently negative, confirming a lack of buying pressure.
-
Volume spike not observed; liquidity remains moderate (11.82'%) but not enough to support a reversal.
-
Market Cap Momentum:
- Market cap declined marginally, yet still above the $3.32'trn threshold.
- The bearish cross indicates a shift in investor sentiment towards downside risk.
Key Drivers & Risk Factors
| Driver | Impact | Risk |
|---|---|---|
| Negative OBV | Supports bearish momentum | May shift if large institutional inflows occur |
| Low Swing Low | Indicates a new support level | Break below could trigger further decline |
| Liquidity (11.82'%) | Adequate for short'term trades | Thin markets can amplify slippage |
| High Trading Price Above Market | Suggests short sellers are active | Market price correction could reduce short edge |
- Critical Risk: Break of the $136.29 support could lead to a rapid move below $135.
- Mitigation: Employ tight stop'loss at $138.00 to protect against sudden retracements.
Actionable Trade Insight
- Trade Type: INTRADAY (short)
- Entry Point: Target $136.80'$137.00 (anticipating a quick pullback to the new swing low).
- Stop'Loss: $138.00 (just above the recent swing high).
- Take'Profit: $134.00 (2'3'pips below the new swing low).
- Risk'Reward: ~1.3:1 ' acceptable given the high conviction level.
Prediction & Confidence
- Signal: SHORT
- Score: 85 (nearest 5 on the 5'95 scale)
- Trade Horizon: INTRADAY ' expect the move within the current trading session.
Call'to'Action:
Time is of the essence. If you want to profit from a clear bearish bias in SOL'USD, subscribe to Auctron's premium signal service now and lock in the edge before the next reversal opportunity passes. Don't let the market's momentum slip away'join today and stay ahead of the curve.
#SOLShortSignal #AuctronCryptoEdge