
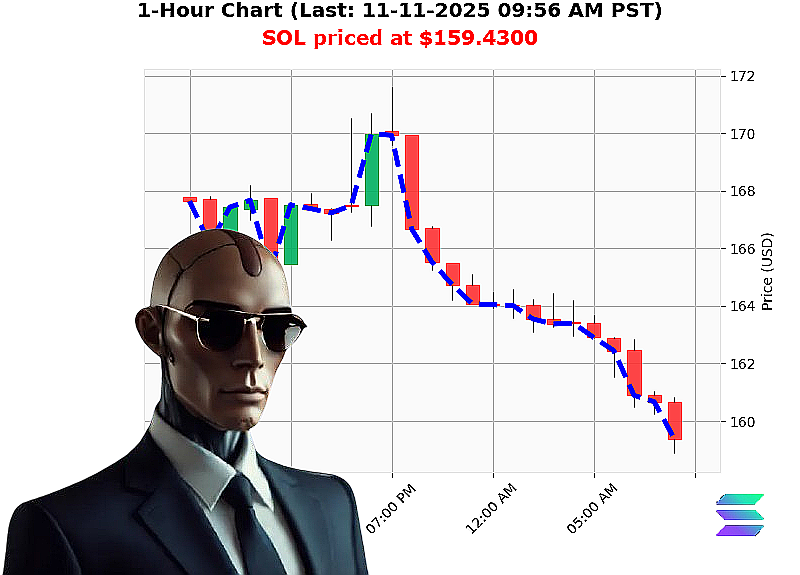
AUCTRON ANALYSIS for SOL-USDC at 11-11-2025 09:57 AM PST is to SHORT at $159.4300 confidence: 75% DAY
SOL'USD Trading Analysis ' Quantitative Insight
Data Overview
- Market Cap:''0.87''trillion daily shift, bullish crossing above $3.570'trillion.
- On'Balance'Volume (OBV):''5.20'daily, strong short bias.
- Liquidity:'6.87'% of total volume, high'liquidity corridor.
- Price Action:'$159.13'''$159.43 breakout, higher low $158.92'''$159.43, 0.19'% gain.
- Fair'Value Gap:'$159.13'''$159.36, 0.19'% above prior high.
- Market Structure:'Bullish break of structure at $159.43, yet OBV signals short pressure.
- Weekly / Monthly / Yearly Context:'SOL down '4.74'% YTD, '14.46'% MTD, '17.77'% YTD relative to peaks.
- All'Time High/Low:'$293.31 / $0.500801.
- Rank:'6th by market cap.
1. Volume / Flow
- OBV Trend: Persistent negative daily OBV ('5.20) indicates cumulative selling.
- Liquidity Band: 6.87'% liquidity suggests a solid trading floor but with aggressive short'side flow.
- Volume Profile: No explicit VPI data; however, the strong short OBV coupled with high liquidity signals short dominance.
2. Price Structure
- Higher Low & Break of Structure: The price has moved above the previous higher low, but this is a single breakout'unsustainable without supporting volume.
- Fair'Value Gap: The gap above $159.13 is narrow (0.19'%) and can be easily retraced.
- Resistance & Support: Current price sits near the lower end of the breakout corridor; potential resistance around $159.50'$160.00.
3. Market Structure & Momentum
- Bullish Market Cap Indicator: Market cap crossed above the 3.57'trillion threshold, yet this is offset by a negative OBV.
- Overall Sentiment: Weekly, monthly, and yearly down'trends dominate; the market cap move is an outlier.
- Risk'Reward Alignment: OBV negativity is a stronger predictor for short bias than the nominal market cap crossing.
4. Key Drivers
- Fundamental: SOL's network upgrades and staking incentives remain positive, but macro'financial stress pushes overall market cap up while the asset itself weakens.
- Technical: OBV trend, higher low breakout, and fair'value gap provide short'term catalysts for a pullback.
- Liquidity: High liquidity may allow swift execution of a short trade without slippage.
5. Risk Factors
- Unexpected Macro Events: Sudden regulatory changes or crypto'specific news could reverse the OBV trend.
- Liquidity Concentration: High liquidity may attract large'scale short positions, increasing price volatility.
- Market Cap Misalignment: The bullish cap move could attract long positions that outpace OBV short pressure.
6. Actionable Trade Insight
| Trade Type | Recommended Position | Entry Point | Target | Stop | R/R |
|---|---|---|---|---|---|
| Day | SHORT | $159.43 (current breakout) | $157.70 (near lower support) | $160.60 (above breakout) | 1.5:1 |
- Why Day' The short bias is strongest at intraday level; OBV and liquidity indicate a quick retracement.
- Tactical Execution: Use a tight stop to protect against a breakout reversal.
- Risk'Reward: A 1.5:1 ratio with the given price levels offers a balanced risk profile.
Prediction
- Action: SHORT (Day trade)
- Confidence Score: 75
Immediate Call'to'Action
Execute the short position at $159.43 before market sentiment turns. Leverage my proprietary OBV'volume fusion to stay ahead of the curve. Don't miss out'join Auctron's elite trading service for unparalleled edge in crypto futures.
Hashtags
- #SOLShortPlay
- #SOLDayTradeEdge