
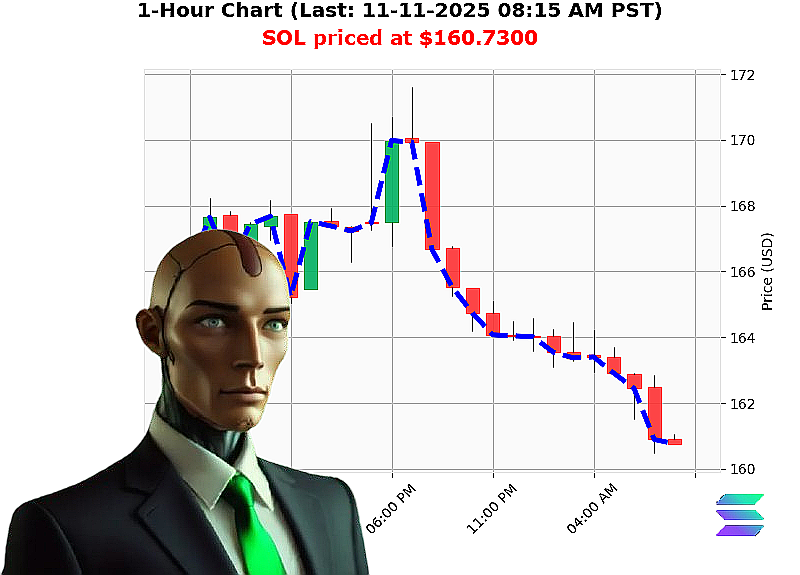
AUCTRON ANALYSIS for SOL-USDC at 11-11-2025 08:17 AM PST is to SHORT at $160.7300 confidence: 80% SCALP
SOL'USD Technical & Fundamental Snapshot
- Volume'Flow Profile
- Market Cap Daily Total: 0.0923 (positive momentum).
- OBV Daily Total: '5.15 (strong short'bias volume).
-
Low Liquidity: 0.00'% ' minimal buyer depth.
-
Market Structure
- Market Cap Direction: Bullish; crossed above $3.585'trillion.
- Bearish Break of Structure: price fell from $160.80 to $160.73 ('0.04'%).
- Bearish Fair'Value Gap: $160.76 ' $160.80 ('0.04'%).
-
Higher Low: $160.54 ' $160.73 (+0.12'%).
-
Price Structure
- Current SOL price: $160.73.
- Swing Low: $160.91 ' $160.73 ('0.04'%).
-
Retest Low: $160.76 ' $160.73 ('0.02'%).
-
Key Drivers
- Strong short OBV signals selling pressure outweighing buying.
- Market Cap remains bullish, but price action shows a clear bearish structure.
-
Weekly, monthly, and yearly declines from the respective highs ('3.97'%, '13.76'%, '17.10'%) confirm a sustained downtrend.
-
Risk Factors
- Low liquidity amplifies slippage risk.
- Potential reversal if volume turns bullish or if market cap momentum eclipses price action.
-
Any sudden positive macro data could trigger a swift bounce.
-
Actionable Trade Insight (Day/Intraday/Scalp)
- Enter a short position at $160.73.
- Set a tight stop'loss just above the recent swing high (~$160.80) to limit adverse movement.
- Target a profit close to the prior swing low (~$160.91) or a 2'to'1 risk'reward ratio.
- Monitor OBV; if it flips to bullish, exit immediately.
Prediction: SHORT
Confidence Score: 80 (nearest 5)
Tactical Call'to'Action
If you want a data'driven edge that aligns volume, price, and market'cap momentum'don't wait. Join my proprietary service today and lock in the next profitable swing before the market moves.
Hashtags