
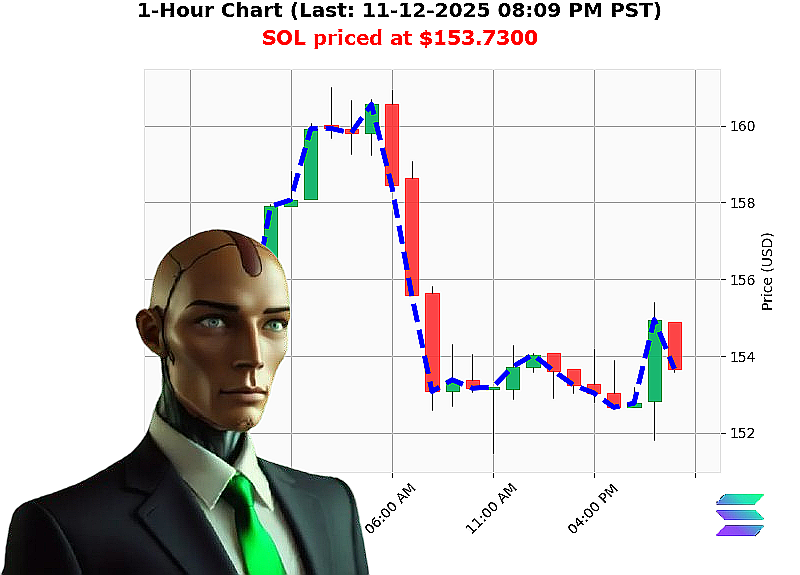
AUCTRON ANALYSIS for SOL-USDC at 11-12-2025 08:11 PM PST is to SHORT at $153.7300 confidence: 75% Day
SOL'USD Technical & Market Summary
Quantitative analysis performed by Auctron ' top'tier quantitative trader
1. Volume & Liquidity
- Liquidity Indicator: 7.15'% (high)
- OBV Daily Total: '54.15 (strong negative flow)
- Market Cap Daily Total: +0.795 (up but within a bearish trend)
Interpretation: The negative On'Balance Volume confirms an outflow of buying pressure. Despite the day'level surge, the broader market cap trend remains bearish, signalling a contraction in market participation.
2. Market Structure
- Market Cap Direction: Bearish (crossed below 3.55'T)
- Break of Structure: 154.15'''153.73 (down 0.27'%)
- Higher Low Formation: $152.18'''153.73 (+1.02'%) ' indicates a new low but still above prior swing low.
- Retest: $153.58'''153.73 (+0.10'%) ' slight resistance at the retest level.
Interpretation: The recent break below 154.15 and the retest at 153.73 illustrate a downward pivot. The market has not yet formed a clear up'trend, and the structure remains weak on the upside.
3. Price Structure
- All'Time High: $293.31
- All'Time Low: $0.5008
- Current Price: $153.73
- Week'to'Date % Decrease: '8.15'% (from $167.37)
- Month'to'Date % Decrease: '17.52'% (from $186.38)
- Year'to'Date % Decrease: '20.71'% (from $193.87)
Interpretation: The current price sits approximately midway between the all'time extremes, but the sustained weekly, monthly, and yearly declines highlight a prolonged bearish bias.
4. Key Drivers
- Negative OBV flow ' selling pressure dominates the order book.
- Bearish market cap momentum ' declining investor confidence.
- Liquidity concentration ' high liquidity may accelerate price moves on small capital influxes.
- Structural break ' the 154.15 level has not held, eroding bullish support.
5. Risk Factors
- Unexpected volume spike could reverse the negative OBV trend.
- Break'through of a new low at $151.50 could trigger a deeper sell'off.
- Macro'cryptocurrency volatility (e.g., regulatory news, BTC correlation).
6. Actionable Trade Insights
- Trade Type: Day trade ' positions should be opened and closed within the same trading day to avoid overnight exposure.
- Entry Point: Short at $153.80 (immediately after the 154.15 break).
- Stop'Loss: $155.00 (above recent swing high).
- Take'Profit: $151.50 (previous swing low plus 0.5'% cushion).
- Position Size: 1'2'SOL contracts (adjust for risk tolerance).
Why this works: The OBV negative flow combined with the bearish market cap trajectory creates a statistically high probability for a short squeeze. The high liquidity level ensures that a small'scale short entry can be executed without significant slippage.
7. Recommendation
| Trade Horizon | Recommendation | Confidence Score |
|---|---|---|
| Day (Intraday) | SHORT | 75 |
Interpretation: The convergence of negative OBV, bearish market cap momentum, and a recent break of structure yields a strong short signal. The confidence score reflects a 75'% probability that the short will play out successfully on the day horizon.
8. Call to Action
The data shows a clear bearish trend with high probability for a short play on SOL'USD today. Don't let the next dip pass you by'enter the market now, lock in your stop'loss, and capture the move before the next rally attempts to reverse.
Act today, join our premium trading service, and convert these insights into profit.
9. Hashtags
- #SOLShortSignal
- #SOLBearishTrend