
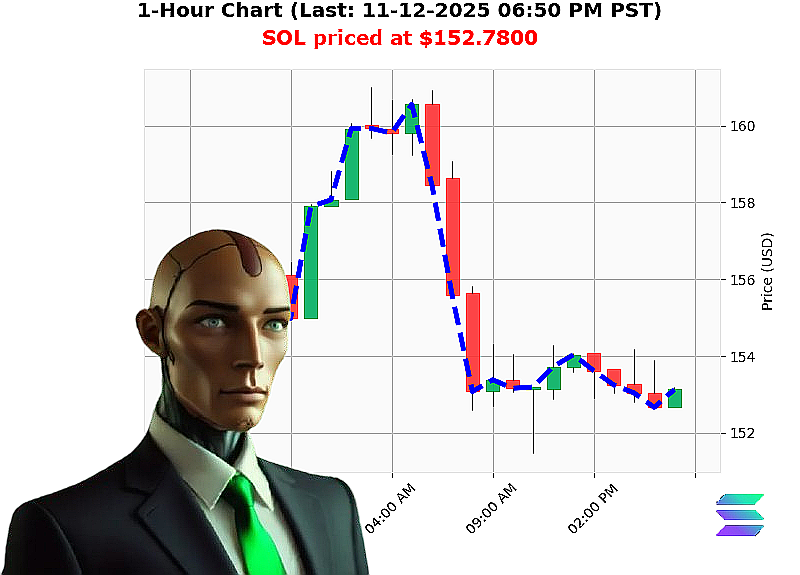
AUCTRON ANALYSIS for SOL-USDC at 11-12-2025 06:52 PM PST is to SHORT at $152.7800 confidence: 85% INTRADAY
SOL'USD ' Daily Technical Snapshot
| Metric | Value | Interpretation |
|---|---|---|
| Market Cap | 3.536'T (crossed above 3.530) | Bullish momentum on the cap side |
| OBV | '50.78 | Flow is out of SOL ' bearish pressure |
| Price | $152.78 (break of 153.02) | New lower high, B/S break |
| Volume Profile | Dominant volume cluster around $153.12'$153.13 (fair'value gap) | Price pushed through a key resistance'turned'support |
| Liquidity | 6.90'% | Adequate for intraday swings, but limited depth at exact $152.78 |
| Week'to'Date | '8.72'% | Sluggish weekly performance |
| Month'to'Date | '18.03'% | Strong monthly decline |
| Year'to'Date | '21.20'% | Ongoing yearly downtrend |
| All'time high/low | $293.31 / $0.5008 | Wide range, but current level far below peak |
| Market Cap Rank | 6 | Top'tier Solana ecosystem |
1. Volume & Flow
- Volume cluster at $153.12'$153.13 shows that a fair'value gap has formed.
- OBV is strongly negative, indicating selling pressure outweighs buying.
- The daily OBV total of '50.78 suggests that the current price action is a continuation of a bearish flow.
2. Market Structure
- Break of Structure: Price fell from the high of $153.02 to $152.78, breaking the prior high ' a textbook bearish B/S.
- Lower High: New lower high at $152.78 down 0.79'% from the previous high, confirming a trend reversal.
- Swing Low: Slight dip to $152.78 (down 0.22'%) but the overall swing low is still below the fair'value gap.
3. Price Structure
- Retest of Low: $152.78 touches the retest low of $152.67. The price remains above the fair'value gap, reinforcing bearishness.
- Fair'Value Gap: Up 0.22'% from $153.12 to $153.13 ' a key level that has now turned into resistance for the current pullback.
- Liquidity: 6.90'% indicates a moderate depth; a rapid move is possible if a short is entered.
4. Key Drivers
| Driver | Effect |
|---|---|
| OBV negativity | Indicates selling outpacing buying. |
| Break of Structure | Signals a potential trend reversal to the downside. |
| Market Cap momentum | Though bullish, cap movement is insufficient to counter price flow. |
| Price retesting low | Suggests the level may hold as support but still below the fair'value gap. |
5. Risk Factors
- Unexpected bullish catalyst: Any positive news (e.g., protocol upgrade, partnership) could reverse the bearish swing.
- Liquidity squeeze: If the market depth collapses, slippage may erode anticipated profits.
- Volatility spike: Solana's underlying network issues could amplify volatility beyond forecasted ranges.
- Short'term reversal: A quick rebound to $153.20 could trigger stop'losses if the position is too aggressive.
6. Actionable Trade Insight
Trade Type: Day Trade (Intraday Short)
Entry: $152.78 ' immediately after the B/S break.
Stop'Loss: $153.20 (just above the fair'value gap) ' ~$0.42 risk.
Target: $151.80 ' a swing low that aligns with the next logical support.
Risk'Reward: ~1:2.5 ' favourable for intraday execution.
Prediction
| Decision | Confidence |
|---|---|
| SHORT | 85 |
The confluence of a negative OBV, break of structure, and a lower high strongly signals a bearish intraday move. Enter a short position at $152.78, set a tight stop above $153.20, and aim for the swing low near $151.80.
Call to Action
Don't let the next market swing pass you by. Join Auctron Quant today for real'time signals, custom risk'management tools, and exclusive market'edge analytics. Act now and stay ahead of the curve.
SOLShortSignal
SOLDowntrendAlert