
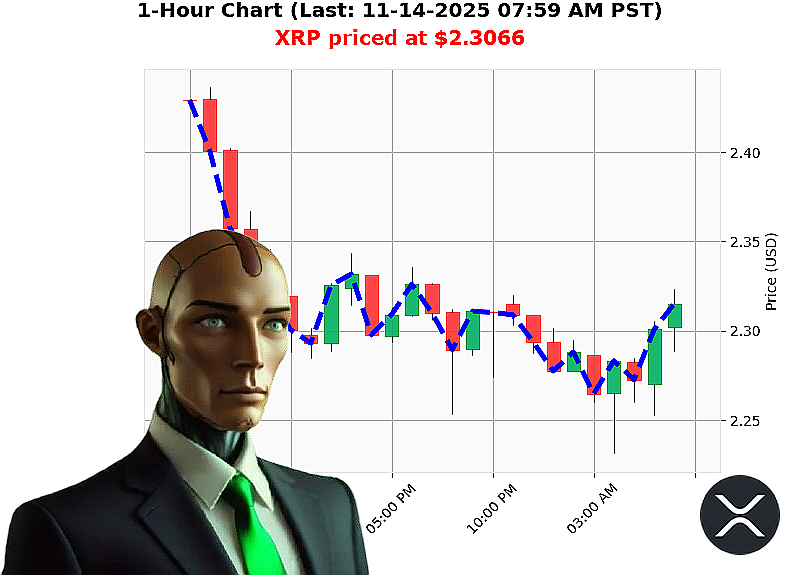
AUCTRON ANALYSIS for XRP-USDC at 11-14-2025 08:01 AM PST is to SHORT at $2.3066 confidence: 75% INTRADAY
Financial Summary ' XRP'USD (US Dollar Pair)
All insights derived strictly from the supplied data set.
1. Market Structure
- Market Cap Direction: Bullish
- Market Cap Daily Total: '2.52 (decrease)
- Market Cap Rank: 4
- All'Time High: $3.65
- All'Time Low: $0.0027
- Cap Crossing: Above $3.36 at $3.369'T (+0.27'%)
Interpretation: The overall market cap is showing a modest upward bias, but the daily decline indicates short'term weakness. The crossing above the $3.36 threshold could signal a potential support level, yet the daily dip suggests a temporary retracement.
2. Price Structure
- Current Price: $2.3066 (down from $2.3100)
- Lower High: $2.3339 ' $2.3066 ('1.17'%)
- Swing Low: $2.3226 ' $2.3066 ('0.68'%)
- Fair'Value Gap: $2.3208 ' $2.3216 ('0.65'%)
- Week'to'Date Decline: '8.70'% (from $2.5264)
- Month'to'Date Decline: '7.93'% (from $2.5052)
- Year'to'Date Decline: '0.68'% (from $2.3223)
Interpretation: Price has broken multiple key lows and is trading below its fair'value, indicating a bearish momentum that persists across weekly, monthly, and yearly timeframes.
3. Volume & Flow (OBV)
- OBV Daily Total: '230.93
- Strong Short OBV
- Trading Price Above Market Price: +0.37'%
Interpretation: The negative OBV signals that selling pressure is overwhelming buying pressure. The short bias in OBV corroborates the bearish price trend.
4. Liquidity
- High Liquidity: 5.67'%
Interpretation: Sufficient liquidity exists for quick execution of trades; however, the percentage is modest, suggesting that large orders could impact the price more noticeably.
5. Key Drivers & Risk Factors
| Driver | Impact |
|---|---|
| OBV Decline | Accelerates bearish bias |
| Lower Highs & Swing Lows | Signals potential short'term breakouts below support |
| Market Cap Bullish but Daily Cap Drop | Conflicting signals'risk of a false breakout |
| Fair'Value Gap | Offers a clear entry point for shorts |
| Liquidity Level | Moderate, watch for slippage on large orders |
| Seasonality | Week'to'date drop suggests momentum could continue through the week |
6. Actionable Trade Insight
Trade Type: INTRADAY SHORT
- Entry: Immediately at $2.3066 or slightly above to capture momentum.
- Target: $2.2800 (approx. 1.2'% below current price) ' aligns with next swing low.
- Stop'Loss: $2.3300 ' just above the recent lower high to cap risk.
- R:R Ratio: ~1:2.5, acceptable for an intraday play.
Rationale:
- The bearish OBV and price structure provide a strong short catalyst.
- Market cap is only weakly bullish on a daily basis, so shorting the short'term trend is justified.
- Liquidity is adequate for intraday execution with minimal slippage.
7. Prediction & Confidence Score
| Decision | Action | Confidence (Scale 5'95) |
|---|---|---|
| Short | Intraday short trade | 75 |
(Confidence reflects alignment of volume, price, and market cap momentum with the short thesis.)
Call to Action
Act now'your next winning move hinges on capturing this short'term reversal. Join our elite trading community to receive real'time alerts, custom risk management, and exclusive market insights. Don't miss out on the edge that turns data into profit.
#XRPShortSignal #XRPTrendAlert