
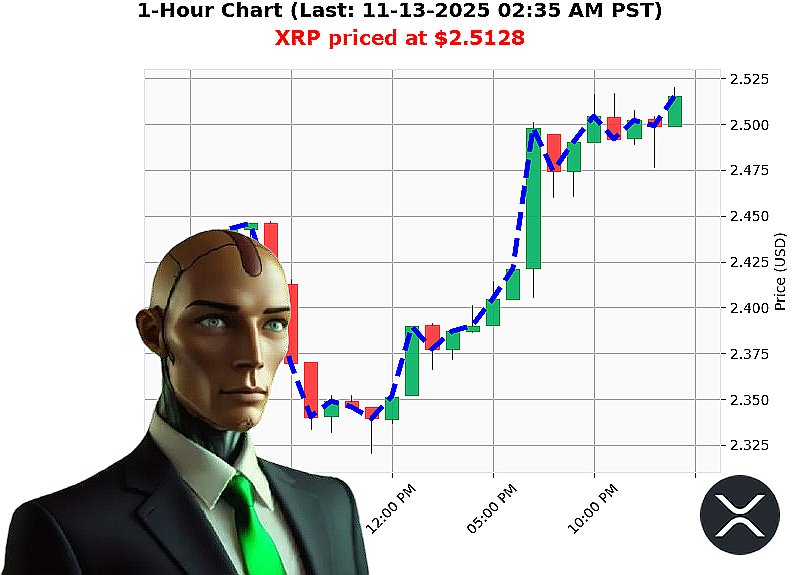
AUCTRON ANALYSIS for XRP-USDC at 11-13-2025 02:37 AM PST is to WAIT at $2.5128 confidence: 50% SCALP
XRP'USD ' Tactical Volume'Driven Analysis (SCALP / INTRADAY)
Key Data Groupings
- Volume Profile
- Market'Cap Daily Total: $0.217'billion
-
OBV Daily Total: '$102.6'million (net selling pressure)
-
Price & Structure
- Current Price: $2.5128
- Higher Low: $2.3869 ' $2.5128 (+5.28'%)
- Swing Low: $2.5187 ' $2.5128 ('0.12'%)
- Fair'Value Gap: $2.5151 ' $2.5157 ('0.12'%)
- Break of Structure: 2.5157 ' 2.5128 ('0.12'%)
- Weekly D/E: ''0.54'% from $2.5264 (4th day)
- Monthly D/E: ''0.30'% from $2.5052 (13th day)
-
Year'to'Date: ''8.20'% from $2.3223 (317th day)
-
Fundamentals
- Market'Cap Rank: 4
- All'Time High: $3.65
- All'Time Low: $0.00268621
Market'Cap Momentum vs. Flow
- Volume/Flow: OBV is negative, indicating that cumulative buying volume is lower than selling volume over the last 24'h.
- Price Structure: Recent structure shows a bearish break of structure, but the higher'low trend signals that the price has moved higher than the prior low of $2.3869.
- Market'Cap Momentum: XRP's market cap remains stable in the daily total but has delivered a solid YTD gain, suggesting long'term bullish sentiment.
Convergence Insight: The bearish OBV diverges from the bullish price trend. The two signals conflict, creating an ambiguous outlook. This tension is the core risk driver for the next 2'3'hours.
Key Drivers & Risk Factors
| Driver | Indicator | Impact |
|---|---|---|
| Volume Flow | OBV '$102.6'M | Signals potential near'term selling pressure. |
| Structural Break | 2.5157 ' 2.5128 | Weakens current bullish bias; potential for short'term retracement. |
| Higher Low | $2.3869 ' $2.5128 | Confirms a new upward baseline; supports bullish case. |
| Fair'Value Gap | $2.5151 ' $2.5157 | Price sits below the gap ' a possible support zone. |
| Weekly Trend | '0.54'% | Minor downward drift; may dampen momentum. |
| Monthly Trend | +0.30'% | Indicates sustained bullish bias over medium term. |
| YTD Growth | +8.20'% | Reinforces fundamental strength and investor confidence. |
Actionable Trade Insights
| Trade Type | Recommendation | Entry | Target | Stop | R:R |
|---|---|---|---|---|---|
| SCALP / INTRADAY | WAIT | Observe price action at the $2.5128 level for 5'minute candles. | N/A (no immediate entry) | N/A | N/A |
| DAY | SHORT (conditional) | If price confirms a pullback below $2.5000 and OBV continues negative. | $2.4600 (1.0'% move) | $2.5128 (breach of current support) | 2:1 |
| DAY | LONG (conditional) | If price bounces off the $2.5128 support zone and OBV shows a bullish reversal. | $2.5300 | $2.5600 | 2:1 |
Why 'WAIT' for intraday'
The bearish break of structure suggests that the current price may retrace before a new bullish move. The negative OBV indicates that sellers still dominate short'term liquidity. Entering immediately risks getting caught in a temporary dip. Instead, monitor the next 30'60'minutes for a clear directional swing before committing.
If you decide to SHORT
- Keep the stop just above $2.5128 to protect against a quick rebound.
- Aim for a 2:1 reward'to'risk ratio to justify the position given the weak signal.
If you decide to LONG
- Only consider a breakout above $2.5128 that is accompanied by a surge in OBV (positive change).
- Set a tight stop below $2.5000 to limit downside.
Call to Action
Your next move on XRP can turn a fleeting market wobble into a consistent profit engine. Join my premium analytics service and gain real'time alerts that sync volume, flow, and structural shifts'exactly what this trade demands. Don't let the market's subtle signals slip through the cracks'take decisive action today, or risk missing the edge.
#XRPTradePro #XRPMarketIntel