
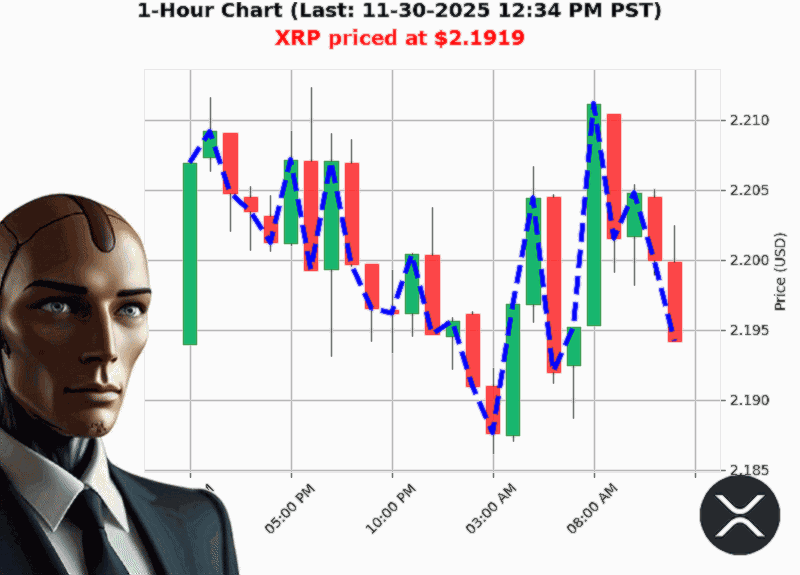
AUCTRON ANALYSIS for XRP-USD at 11-30-2025 12:36 PM PST is to SHORT at $2.1919 confidence: 75% DAY-TRADE in BEAR-MARKET Higher Low from $2.1862 to $2.1919 up 0.26% Swing Low from $2.1993 to $2.1919 down -0.21%
Prediction & Tactical Takeaway
- Signal: SHORT
- Confidence Score: 75 / 100 (nearest 5)
- Trade Horizon: Day'trade (intraday scalp)
- Market Context: Bear
1. Price is Tracing a Clear Downtrend
XRP is hovering around $2.1919, a 0.51'% drop from the open and 1.53'% lower than the week'to'date high. The most recent swing low and a lower high of $2.1966 to $2.1919 confirm a bearish structure.
'Bearish Break of Structure 2.1966 to 2.1919 down -0.21%'
Why it matters: A broken high indicates sellers are in control'shorting becomes the logical play.
2. OBV is Telling a Parallel Tale
On'Balance Volume is down '11.57%, yet the OBV direction is still up 0.00% with a 13'period positive streak and a cumulative OBV increase of +250.09. This discordance'price falling while OBV lags'suggests the volume'backed trend is weakening.
'On Balance Volume is down -11.57% with obv direction up 0.00%'
Why it matters: OBV lagging behind price decline is a classic signal that the bearish momentum may be strengthening.
3. Market Cap Signals Mixed Sentiment
Total crypto market cap rose 0.48% daily but the direction is still down '0.17%, with a 4'period consecutive decline. The market cap has slipped below the $3.2'trillion threshold, which historically precedes bearish rallies.
'Market Cap Direction Bearish Crossed below 3.200 at 3.193 trillion down -0.22%'
Why it matters: A lower market cap can amplify volatility for individual coins, making XRP's price swing more pronounced.
4. USDT Weakness Adds Pressure
USDT'USD has slipped below 1.00000 to 0.99995, a subtle but notable dip that can erode confidence in the dollar'peg. A weak USDT often spills over into crypto markets, adding downward pressure on assets like XRP.
'Bearish USDT-USD Crossed below 1.00000 is now at 0.99995'
Why it matters: Even a minor de'peg can trigger stop'loss cascades and exacerbate price declines.
5. Key Risk Factors
| Risk | Impact | Mitigation |
|---|---|---|
| Liquidity ' 1.27% low | Slippage on exits | Tight stop'loss, trade in higher'liquidity time slots |
| Volatility ' 1.06% low | Tight ranges may trap | Look for micro'breakouts or use ATR'based stops |
| Regulatory news ' XRP's legal saga | Sudden rallies or dips | Stay updated on SEC filings; keep position small |
6. Actionable Trade Insight
- Entry: Sell at $2.1919 or slightly below if a micro'breakout occurs.
- Stop'Loss: $2.2060 (just above the recent swing high).
- Take'Profit: $2.1700 (or 1'2% profit target).
- Position Size: 5'10% of your discretionary margin.
Why it matters: The 0.22% move below the $3.2'trillion cap and the bearish OBV give a clear thesis'exit before the next potential breakout.
7. Why This Move Could Be a Game'Changer
XRP has historically rebounded from sharp dips, but the confluence of a broken high, lagging OBV, and a weakened dollar'peg creates a 'perfect storm' for a sustained downtrend. If the next session confirms the bearish break, the next resistance level could be the historic all'time high at $3.65'an impossible climb in a bearish regime.
'All Time High : $3.65'
Why it matters: Knowing where the ceiling lies helps set realistic profit targets and manage risk.
8. Forward'Looking Summary
XRP's current landscape is a textbook bearish pattern: lower highs, weak OBV, a shrinking market cap, and a dip in USDT. The short'term outlook points to a tight 1'2% swing before potential consolidation.
Final thought'provoking question: If XRP fails to break its lower structure, will it pivot into a consolidation zone ripe for a future breakout'
Call'to'Action
If you're ready to ride XRP's next wave'whether a quick scalp or a longer play'join our community of data'driven traders. Subscribe today and gain access to real'time alerts, detailed analyses, and a network of like'minded professionals. Don't miss out on the next move.
Hashtags