
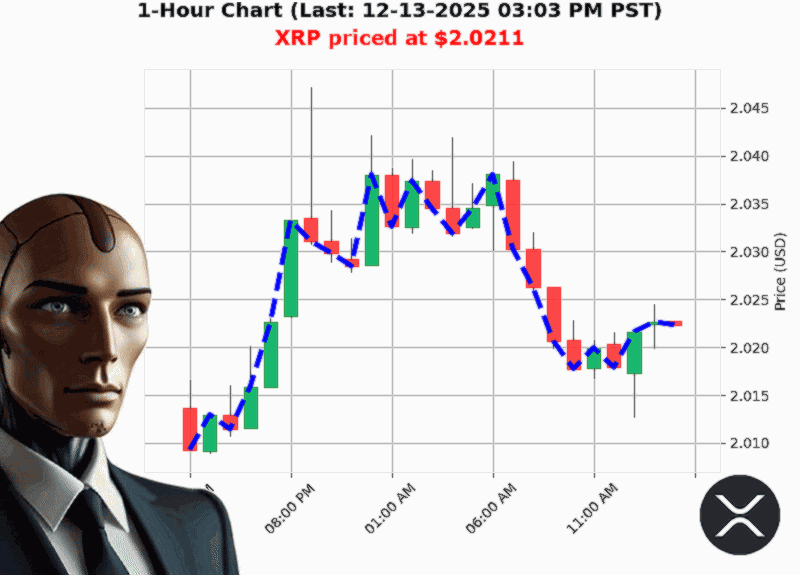
AUCTRON ANALYSIS for XRP-USD at 12-13-2025 03:06 PM PST is to SHORT at $2.0211 confidence: 70% DAY-TRADE in BEAR-MARKET Bullish XRP price crossed above $2.0200 to $2.0211 up 0.09% Lower High from $2.0470 to $2.0211 down -1.27% Swing Low from $2.0227 to $2.0211 down -0.06% Retest Low of $2.0214 with $2.0211 down -0.02%
Prediction
- Signal: SHORT
- Confidence Score: 70 (scale 5'''100)
- Trade Type: DAY
- Market Phase: BEAR
1.'Bullish Engulfing That Didn't Last
XRP just nudged above $2.0200 with a 0.09'% gain, but the move collapsed almost immediately. The bullish engulfing candle is a classic reversal cue, yet it was followed by a sharp retracement to $2.0211, falling 0.02'%.
'Bullish XRP price crossed above $2.0200 to $2.0211 up 0.09%.'
Why it matters: A single bullish candle can be a false alarm if the underlying structure remains bearish. Traders should view this as a partial correction rather than a trend reversal.
2.'Lower High & Swing Low: Down'Trend Confirmation
The pair's recent lower high (from $2.0470 to $2.0211) and swing low (from $2.0227 to $2.0211) confirm a down'trend despite the brief uptick.
- Lower High: '1.27'%
- Swing Low: '0.06'%
Takeaway: In a bearish structure, any new highs that fail to surpass previous ones are weak signals. The trend is still leaning downward.
3.'On'Balance Volume: Divergence on the Downward Side
OBV has been up 26.32'% overall, yet its direction is down '0.18'% with a consecutive count of '2. The cumulative OBV is still up +36.7206, but the recent downward momentum indicates that buying pressure is fading.
Why it matters: Volume that fails to back a price move is a classic bearish divergence. It suggests that the upward momentum lacks conviction.
4.'Fair Value Gap & Break of Structure: Bearish Confirmation
A fair'value gap from $2.0217 to $2.0224 (down '0.06'%) coupled with a break of structure (2.0224 ' 2.0211) points to a loss of support. In chart'theoretic terms, a bearish BOS is a red flag for traders expecting further declines.
Bottom line: The gap and BOS together give a robust bearish signal that the market is not ready to climb back above $2.0200.
5.'Market'Cap Growth vs. Price Decline: Divergence Alert
While the crypto market cap ticked up 0.23'% to $3.166'trillion, XRP's price is down year'to'date by 12.97'% from its all'time high. The discrepancy suggests that the broader crypto environment is not supporting XRP's recovery.
Implication: Avoid buying into XRP simply because the market cap is rising; the underlying asset remains weak.
6.'Low Volatility & Liquidity: The 'Steady' Risk
Volatility sits at 1.08'% and liquidity at 1.36'%, both on the lower side. While low volatility can mean fewer price swings, it also signals that there is less price action to trade on. For scalpers, this translates to tighter spreads and higher slippage.
Strategic note: If you're a scalper or intraday trader, consider tightening stop'losses and position sizes to mitigate the risk of sudden price gaps.
7.'Timing the Short: Day'Trade Play
Given the bearish structure, OBV divergence, and failure of the bullish engulfing to hold, a day'trade short is the most defensible move. Target the retest low at $2.0214 and place a stop above the most recent high ($2.0224).
Exit plan:
- Profit target: $2.0190 (approx. 1.3'% below entry)
- Stop'loss: $2.0250 (just above the recent high)
Final Thought'Provoking Question
Will XRP continue its downward bias and break below the key support at $2.0190, or will a sudden reversal push it back above $2.0210'
Call'to'Action
Don't let the next price move catch you off'guard. Subscribe to our premium signals for real'time alerts and a 15'day free trial. Stay ahead of the market'your wallet will thank you.
#XRPShortPlay #XRPTrading