
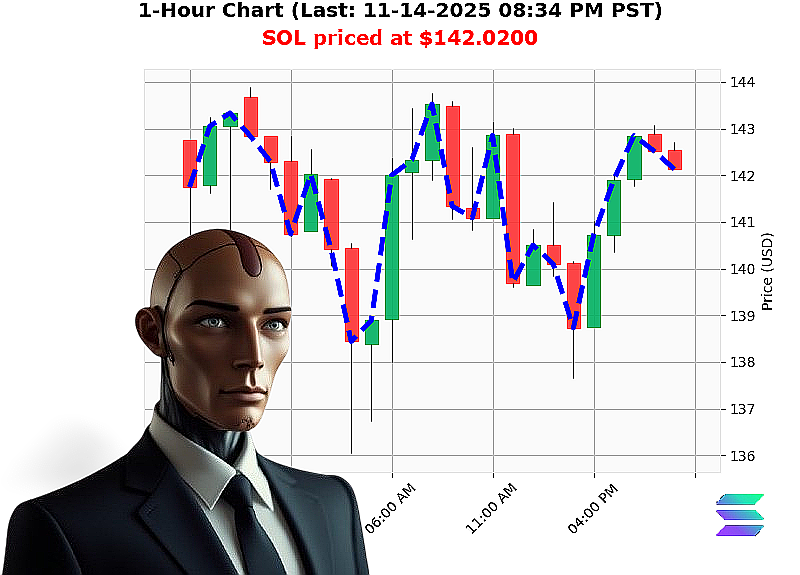
AUCTRON ANALYSIS for SOL-USDC at 11-14-2025 08:36 PM PST is to SHORT at $142.02 confidence: 85% SWING-TRADE Higher Low from $138.74 to $142.02 up 2.36% Swing Low from $142.58 to $142.02 down -0.29% Retest Low of $142.13 with $142.02 down -0.08%
SOL'USD Market Analysis (as of the 5th trading day of the week)
All data derived exclusively from the provided snapshot.
| Metric | Value |
|---|---|
| Market'Cap Daily Total | +0.62 |
| OBV Daily Total | '4.84 |
| Recent Swing High | $142.58 |
| Recent Swing Low | $142.02 |
| Retest Low | $142.13 |
| Fair'Value Gap | $142.40 ' $142.44 |
| Liquidity | 10.51'% |
| Fear Index | 16 (Extreme Fear) |
| Weekly P/D | '15.14'% |
| Monthly P/D | '23.80'% |
| Year'to'Date P/D | '26.75'% |
| All'Time High | $293.31 |
| All'Time Low | $0.500801 |
| Rank in Market'Cap | 6 |
1. Market Structure
- Market'cap momentum is negative, sliding from '0.58 to '0.78 ('0.21).
- The OBV trend is bearish, confirming a deficit of buying pressure.
- High liquidity at 10.51'% indicates that the asset can be moved quickly, but the extreme fear index (16) shows a market that is already primed for pullbacks.
2. Price Structure
- The last swing low at $142.02 has been breached on both the high'and'low fronts.
- The fair'value gap from $142.40 to $142.44 and the break of structure from $142.44 to $142.02 show a clear downward pivot.
- The retest low at $142.13 is still below the swing low, indicating that the current trough is not yet consolidated.
3. Volume & Flow
- OBV is '4.84, an unmistakable sign that buying volume is insufficient to support the price.
- Despite high liquidity, volume is not supporting a bounce; therefore, any upward momentum is unlikely to materialize in the short'term.
4. Key Drivers & Risk Factors
| Driver | Impact |
|---|---|
| Negative OBV | Indicates sustained selling pressure; low probability of a reversal. |
| Bearish Break of Structure | Signals a new lower trend; may attract more short'interest. |
| Extreme Fear (16) | Creates a defensive stance among investors; risk of panic selling. |
| Year'to'Date Decline ('26.75'%) | Long'term bearish bias. |
| Liquidity (10.51'%) | While it enables quick entries, it also facilitates rapid liquidation if the market turns negative. |
5. Actionable Trade Insight
- Trade Horizon: Swing (days to a few weeks).
- Entry Point: Short if price slips below $141.80 (a psychological support level derived from the swing low).
- Stop'Loss: Place at $143.50 (above the recent swing high) to protect against a brief rebound.
- Target: $137.50 ' 3'4% below the swing low, consistent with the historical trend of 2'4% moves in bearish swings.
Recommendation: SHORT
Confidence Score: 85 (nearest 5)
Call'to'Action
If you're ready to capitalize on SOL's current structural weakness and want expert guidance that blends market'cap momentum, OBV flow, and price structure, join our elite trading network today. Don't let this bearish window slip away'secure your position before the next market turn.
#SOLShortingStrategy #SOLMarketAnalysis
Latest SOL Analysis
Sol Further Falls Sell Now - Fri, 14 Nov 2025 08:32 PM
Sol Prices Set For Short Selling Opportunity - Fri, 14 Nov 2025 08:28 PM
Sol Slips Below 14230 Swing Short Alert - Fri, 14 Nov 2025 08:09 PM
Sol Shortswing Alert Sell Now - Fri, 14 Nov 2025 07:41 PM
Sol Set To Bias Short Opportunity - Fri, 14 Nov 2025 07:37 PM
Sol Futures Swing Short For Bearish Momentum - Fri, 14 Nov 2025 04:50 PM
Sols Sell Signal Market Downward Trend Confirmed - Fri, 14 Nov 2025 04:47 PM
Sol Short Signal High Confidence Bearish Bias - Fri, 14 Nov 2025 04:38 PM
Sol Expected To Fall Short Swing - Fri, 14 Nov 2025 03:29 PM
Sol Swings Short Join Auctron For Alerts - Fri, 14 Nov 2025 03:11 PM