
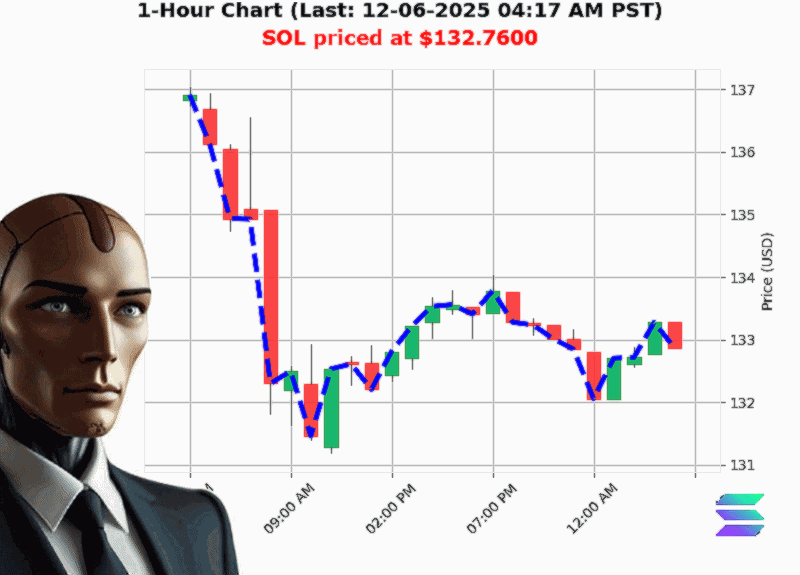
AUCTRON ANALYSIS for SOL-USD at 12-06-2025 04:26 AM PST is to BUY at $132.76 confidence: 70% INTRADAY-TRADE in RANGE-MARKET Lower High from $133.92 to $132.76 down -0.87% Swing Low from $132.90 to $132.76 down -0.08% Retest Low of $132.87 with $132.76 down -0.08%
SOL'USD ' A Tight'Knit Snapshot of the Current Market
'When price is stubborn but volume is eager, the next move can be surprisingly swift.'
Below is a distilled, step'by'step analysis of Solana (SOL'USD) that pulls together price structure, volume dynamics, market'cap sentiment, and key risk levers. The goal' To give you a clear, tactical snapshot you can act on today.
1. Price Structure ' Swing Low, Fair'Value Gap, Break of Structure
The chart is currently riding a tight $133.92 ' $132.76 range. A lower high sits at 133.92 while the swing low is a razor'thin 132.76 (down 0.08%). Crucially, a bullish fair'value gap appears right above the swing low (132.87'132.94). That gap, combined with the recent break of structure at 132.87 ' 132.76, signals a brief bearish move that could be followed by a bounce from the gap zone.
Takeaway: The pair is 'stuck' between a small dip and a tiny rebound; the next move could be a quick correction back toward the gap level.
2. Volume Vigor ' OBV Turning Bullish
Despite SOL's 0.41% intraday decline, the On'Balance Volume (OBV) is up 0.90% and has been climbing for 55 consecutive periods'an emphatic sign that buying pressure is building. OBV's cumulative count is up 83, with a total increase of +13,048. In other words, volume is saying 'I want to lift this price.'
Takeaway: Price is softening, but the underlying momentum is bullish'an ideal setup for a short'term rally.
3. Market'Cap Sentiment ' A Slight Bullish Tilt
The crypto'market cap is down 1.73% for the day, yet its cumulative increase is +0.3835% and the direction is up 0.0141%. SOL sits at market'cap rank #7 with an all'time high of $293.31. The overall market is slightly bullish, and that tailwind can help SOL's short'term rebound.
Takeaway: A modest upward bias in the wider market can provide a cushion for SOL's near'term upside.
4. Risk Factors ' Year'to'Date Decline & High Volatility
Year'to'date, SOL has slid '31.52% from its 193.87 peak, indicating a long'term bearish bias. Combined with the recent swing'low volatility, traders must remain wary of a potential reversal back toward the lower side of the range. Position sizing should be conservative; consider setting tight stop'losses just below the swing low at 132.70.
Takeaway: Don't forget the long'term trend ' the short'term rally could be a mere retracement.
5. Tactical Insight ' Intraday 'Buy' for a Quick Bounce
Market Classification: Range ' the price is oscillating within a tight band.
Prediction for an intraday trade: BUY ' targeting a quick rise back to the fair'value gap zone (~132.90'133.00).
Confidence Score: 70/100 (moderately confident).
Why'
- OBV bullish momentum outweighs the small price dip.
- The fair'value gap provides a natural support target.
- The market'cap trend is slightly upward, giving the rally a supportive backdrop.
Action Plan
1. Entry: 132.80'132.85 (just above the swing low).
2. Take'Profit: 132.90'133.00 (fair'value gap level).
3. Stop'Loss: 132.70 (just below the swing low).
If the price stalls past the gap, consider WALL (wait) and reassess. If the gap fails, you may pivot to a SHORT with the same risk'reward framework.
Final Thought
In a world where volume can outpace price, the next few minutes could hold the next decisive move. Will Solana's bullish OBV finally lift the price, or will the underlying bearish trend hold firm'
Question for You: How will you balance the short'term bullish signals against the long'term decline when sizing your next position'
Ready to ride the next wave' Join our community for real'time alerts, deeper dives, and the edge that turns data into profit.
Call'to'Action: Subscribe today and never miss a market'moving signal.
#SOLStrong #SOLRise