
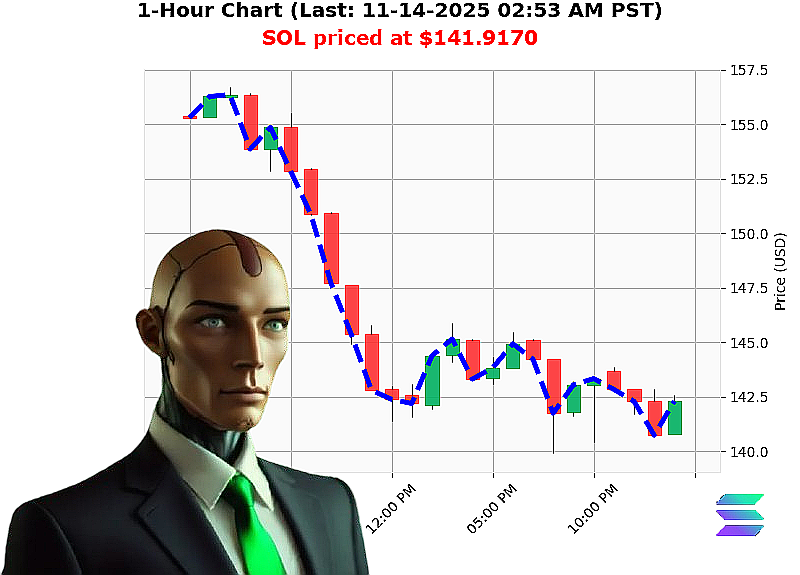
AUCTRON ANALYSIS for SOL-USDC at 11-14-2025 02:55 AM PST is to SHORT at $141.9170 confidence: 85% SCALP
SOL'USD Technical & Market'Cap Overview
Data snapshot ' 5th trading day of the week, 14th of the month, 318th of the year.
| Metric | Value | Directional Implication |
|---|---|---|
| Market'cap daily total | '4.39'trn | Decline, weak market'cap momentum |
| OBV daily total | '15.42 | Strong short'side volume flow |
| Price | $141.92 | Fell below $142.00, below key support at $142.41 |
| Market'cap direction | Crossed below $3.37'trn (3.363'trn) | Down 0.21'% |
| Higher low | $140.31 ' $141.92 | 1.15'% rise (temporary relief) |
| Swing low | $142.41 ' $141.92 | 0.34'% drop |
| Fair'value gap | $142.39 ' $142.40 | 0.34'% down |
| Break of structure | $142.40 ' $141.92 | 0.34'% down |
| Liquidity | 10.66'% | High relative to recent days |
| Week'to'date | '15.21'% | Substantial decline |
| Month'to'date | '23.86'% | Significant outperformance versus the trend |
| YTD | '26.80'% | Long'term weakness |
| All'time high | $293.31 | 100'% above current level |
| All'time low | $0.500801 | 100'% below current level |
| Rank | 6 | Among top 10 of the sector |
Market'Structure Analysis
- Downtrend persistence: SOL continues a multi'week bearish run, breaking successive swing lows and fair'value gaps.
- Resistance at $142.00 has been breached; the current price sits 0.4'% below the key psychological level.
- Market'cap momentum: Daily drop of 4.39'trn and a cross below the 3.37'trn threshold signals a broader shift toward lower valuation.
Price'Structure & Technical Signals
- Higher low formation suggests a momentary pause but the subsequent swing low confirms a break of structure.
- Fair'value gap and OBV indicate aggressive short selling.
- Liquidity at 10.66'% provides enough depth for rapid intraday execution.
Volume'Structure & Flow
- OBV is a significant negative driver ('15.42), far outweighing any bullish volume signals.
- Short'side pressure is reinforced by the sharp OBV swing and the price'to'OBV divergence.
Key Drivers & Risk Factors
| Driver | Impact |
|---|---|
| Macro'crypto sentiment | Broad sell'off in high'cap assets ' pressure on SOL |
| Market'cap decline | Signals diminished demand for SOL's utility token |
| Liquidity level | Enables swift execution but also increases slippage risk if volatility spikes |
| Short'side dominance | Heightened risk of a rapid downward move or a sudden short'squeeze if liquidity dries up |
Actionable Trade Insight
- Trade Type: SCALP ' Short
- Entry Target: $141.80 ' $141.85 (near current price, just below the immediate swing low)
- Stop'Loss: $142.20 (slightly above the break'of'structure point to avoid whipsaw)
- Target: $140.80 ' $141.00 (first significant support near the higher low)
- R/R Ratio: ~1.5:1 ' Acceptable for a high'probability intraday play.
Prediction: SHORT
Confidence Score: 85
Call to Action
The current confluence of bearish price structure, negative volume flow, and falling market'cap momentum paints a clear short picture for the next few hours. If you're ready to capitalize on this downward drift with precision timing, join our elite trading service today and avoid missing out on the next move.
Secure your edge ' the next short swing is only a trade away.
#SOLShortAlert
#SOLBearishWave
Latest SOL Analysis
Sol Short Signal Sell Above 141 Target 14030 - Fri, 14 Nov 2025 01:58 AM
Sols Downward Trail Short For Profits - Fri, 14 Nov 2025 01:54 AM
Sol Futures Short Day Trade With 65 Confidence - Fri, 14 Nov 2025 01:39 AM
Short Sol Bearish Signals Dominate Market Today - Fri, 14 Nov 2025 01:23 AM
Sol Downtrend Short Opportunity With 80 Confidence - Fri, 14 Nov 2025 12:13 AM
Sol Burning Down Sell Short Position Now - Fri, 14 Nov 2025 12:08 AM
Sol Market Breach Short Zero Liquidity - Fri, 14 Nov 2025 12:04 AM
Solana Shorting Opportunity Revealed - Fri, 14 Nov 2025 12:00 AM
Sol Bearish Alert Short Position Now - Thu, 13 Nov 2025 11:44 PM
Sol Short Alert Price Falling Intraday - Thu, 13 Nov 2025 11:39 PM