
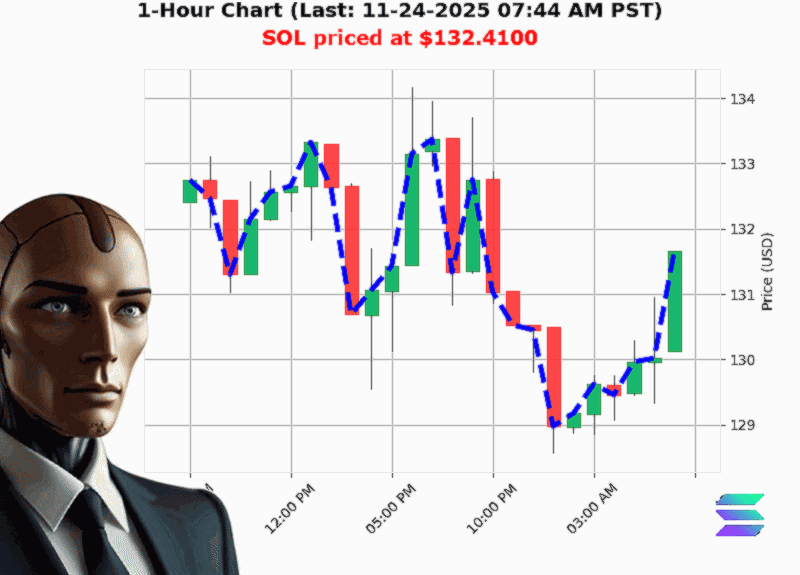
AUCTRON ANALYSIS for SOL-USD at 11-24-2025 07:48 AM PST is to BUY at $132.41 confidence: 80% INTRADAY-TRADE in BULL-MARKET Bullish SOL price crossed above $132.00 to $132.41 up 0.40% Higher Low from $128.60 to $132.41 up 2.97%
SOL'USD Trading Outlook: 7 Surprising Insights You Can't Ignore
'SOL price crossed above $132.00 to $132.41 up 0.40%.'
''Data Snapshot, 11'24'2025
1. A Daily Power'Up: SOL's 1.33'% Surge
The coin kicked off the session on a positive note, rising 1.33'% from open to $132.41.
- Consecutive ups: 2 sessions in a row.
- Cumulative rally: +$0.73 on the day.
With the price already above the $132.00 pivot, the market structure is bullish for the day. If you're a short'term trader, that's the kind of momentum that feeds intraday or scalping setups.
2. Market'Cap Momentum Favors the Bull
Crypto's total cap sits at $3.041'trillion and is up 0.36'% after slipping 0.42'% yesterday.
- Daily direction: +0.29'%.
- Consecutive days up: 2, with +0.44'% each.
A rising market cap signals broader investor confidence. When the cap climbs, the individual coins riding that wave'SOL included'often follow suit. Think of it as a 'major'currency'boost' effect that can smooth out intraday volatility.
3. Fair'Value Gap + Break of Structure: A Clear Bullish Signal
SOL's price moved from a fair'value gap of $131.66'$132.00 to $132.41, an increase of 0.57'%.
- Break of Structure (BOS): 131.66 ' 132.41 (''0.57'%)
When a token closes above a gap and confirms a BOS, it demonstrates that buyers are willing to absorb the price lift. That's a textbook bullish reversal pattern'great fodder for intraday traders.
4. Liquidity + Fear: Low'Risk Environment
- Liquidity: 6.70'% (high, meaning tight spreads).
- Fear Index: 12 (on a 0'100 scale, this is extreme calm).
- Price'to'Market'Cap differential: Trading price is 0.31'% below the market cap benchmark.
High liquidity and low fear reduce execution risk, making it easier to hit your target exits on a scalping or day'trade basis.
5. On'Balance Volume Is a Contradiction
OBV rose 9.90'% overall, but its direction dipped 0.02'% and the consecutive OBV count is down by 2.
- Cumulative OBV down: '$14.76
This suggests that although the volume is high, the buy pressure is slightly waning. It's a cautionary flag'ideal for a quick profit'take before any potential pullback.
6. Monthly & Yearly Declines: A Long'Term Warning
- Month'to'Date: '28.96'% from a high of $186.38.
- Year'to'Date: '31.70'% from $193.87.
Despite the short'term rally, the coin remains trough'seasonal in the longer view. This is the reason why a 'buy' should be time'locked to a near'term horizon rather than an overnight position.
7. Bottom Line: Trade for the Day, Not the Season
Signal: BUY (short'term).
Trade Type: INTRADAY (or DAY, not SCALP).
Market Context: BULL (momentum, higher lows, BOS).
Confidence Score: 80 (out of 100, rounded to the nearest 5).
Why' The price structure is bullish, liquidity is healthy, and the market cap trend supports a rally. The OBV flag is a warning but not a shutdown. Stick to a tight stop near $131.70 and target $134.50'$135.00.
Forward'Looking Question
If SOL continues its current path, could it break its all'time high of $293.31 before the next cycle, or will the month'to'year decline reset the trend'
Call to Action
Ready to ride the next SOL wave' Join my trading community for real'time alerts, deep'data analysis, and exclusive strategy insights that turn volatility into profit. Don't let the next rally slip past you'subscribe today!
Hashtags: