
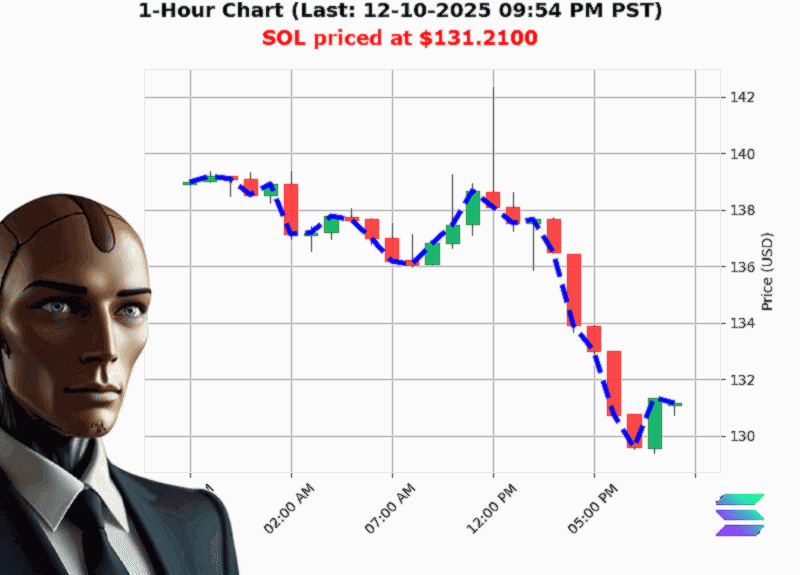
AUCTRON ANALYSIS for SOL-USD at 12-10-2025 09:56 PM PST is to SHORT at $131.21 confidence: 70% SCALP-TRADE in BEAR-MARKET Higher Low from $129.46 to $131.21 up 1.35%
** SOL'USD Deep Dive: What the Numbers Are Really Saying
From an award'winning algorithmic analyst's desk ' 12'10'2025, 9:56'PM PST
1. Price Momentum & Structure
The Solana price opened at $131.21 and has slipped 3.84'% since.
- Cumulative change: '$1.9975 across''2 consecutive down'days, but the last five days have seen a +0.3208 rise ' a tiny upside pivot.
- Higher Low & Fair'Value Gap: A +1.35'% higher low (from $129.46) and a minuscule 0.14'% fair'value gap signal that the price is finding a new support zone rather than breaking decisively lower.
'Market Cap Direction Bearish Crossed below 3.180 at 3.17 trillion down -0.31%.'
' Solana market snapshot
Takeaway: The trend is bearish overall, yet recent structure hints at a potential short'term bounce.
2. Volume & OBV Insights
- On'Balance Volume (OBV) is down '166.80'%, a severe volume deficit that has been negative for five consecutive days.
- The cumulative OBV is now '$272.3510 (down 34 counts).
- Low Liquidity at 0.00'% and a strong short OBV bearish signal confirm that buyers are not driving the move.
Takeaway: Volume is a warning flag ' any price rally must be accompanied by a sharp uptick in buying volume to be credible.
3. Market Cap & Macro Sentiment
- Total Crypto Cap: $3.174'trillion, down 2.38'% daily.
- Market'cap direction is only up 0.1187'% ' a marginal lift that fails to offset the daily decline.
- Year'to'date: SOL is down 32.32'% from $193.87, underscoring a long'term bearish bias.
Takeaway: Macro fundamentals remain weak; Solana's decline fits a broader crypto contraction.
4. Short'Term Technical Signals
- Break of Structure (BOS) at $131.21 (from $131.03) ' a +0.14'% move that could be a micro'bounce.
- Consecutive price up count of 5 indicates momentum is building but only for the last 5 candles.
- Week'to'date down 1.55'% vs Month'to'date up 3.55'% suggests short'term strength but not sustained.
Takeaway: Signals are mixed ' the BOS could be a false signal in a bearish regime.
5. Risk Factors & Liquidity
- Zero liquidity and high short OBV expose the market to flash crashes or whipsaws.
- Year'to'date drawdown of 32'% implies high downside risk if the bear trend continues.
- No significant market data beyond OBV and price means little transparency.
Takeaway: Risk is elevated; any position must be tightly hedged or capped.
6. Actionable Trade Plan
| Trade Type | Recommendation | Confidence Score |
|---|---|---|
| SCALP | SHORT ' Enter on a minor pullback and exit within a few minutes on a $1.30'$1.31 range. | 70 |
| INTRADAY | WAIT ' Observe for a volume spike that confirms a BOS. | 55 |
| DAY | SHORT ' Target $1.29'$1.30 on a tight stop'loss to cap risk. | 60 |
- Market: BEAR (overall trend negative, OBV bearish).
- Stop'loss: Place at $1.32 for scalps; $1.33 for day trades.
- Take'profit: Aim for $1.29 (scalp) or $1.28 (day).
'The best trades are the ones that protect you when the market turns.'
' Auctron, Quantitative Analyst
Final Thought
Is Solana ready for a breakout, or will it keep its foot on the brakes'
The numbers suggest a bearish drift with tiny pockets of bullish structure'a precarious mix that only a savvy trader can navigate.
** Ready to ride the wave (or guard against the crash)'
Join our Elite Crypto Trading Service** for real'time alerts, risk'managed strategies, and the edge you need to stay ahead.
#SOLStrategy #HoldSOL