
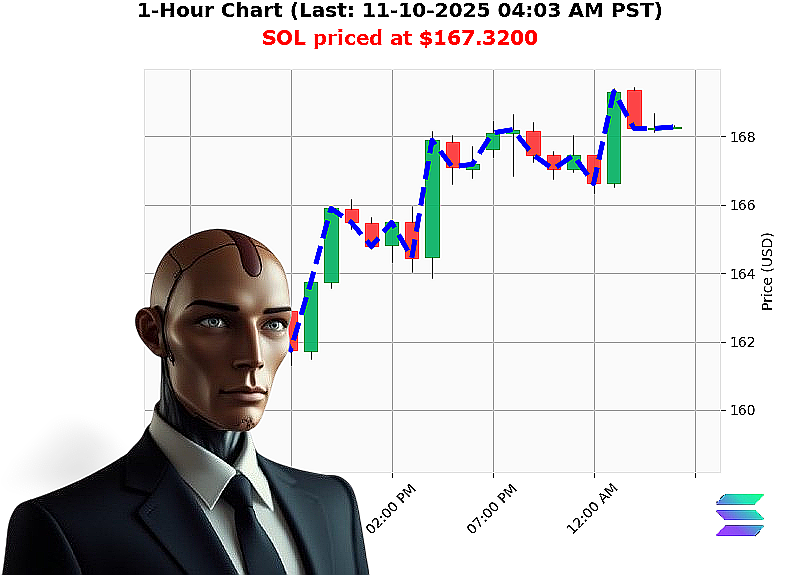
AUCTRON ANALYSIS for SOL-USDC at 11-10-2025 04:05 AM PST is to SHORT at $167.3200 confidence: 75% INTRADAY
Crypto Futures Trading Analysis ' SOL'USD
Market Snapshot (Day & Week)
| Item | Value |
|---|---|
| Market Cap Daily Total | 5.589'trillion |
| OBV Daily Total | 45.814'B |
| Market Cap Direction | Bearish (crossed below 3.690'trillion) |
| Liquidity | 6.03'% |
| Trading price vs. market price | 0.57'% above |
| Price Action | Bearish engulfing '0.8142 ('''200'%) |
| Higher Low | $164.00 ' $167.32 (+2.02'%) |
| Swing Low | $168.41 ' $167.32 ('0.54'%) |
| Bearish BOS | $168.20 ' $167.32 ('0.52'%) |
| Weekly | +1.74'% from $164.45 |
| Monthly | '10.23'% from $186.38 |
| YTD | '13.70'% from $193.87 |
| All'Time High | $293.31 |
| All'Time Low | $0.500801 |
| Rank | 6 |
Volume / Flow Profile
- OBV shows a cumulative total of 45.8'B, yet the daily net flow is negative, signaling selling pressure outweighing buying momentum.
- Liquidity remains solid at 6.03'%, allowing for rapid entries and exits but also amplifying the impact of bearish moves.
- The market cap has dipped below the 3.690'trillion threshold, a critical support now acting as a dynamic floor that is likely to trigger further selling if breached.
Price & Market Structure
| Structure | Current Level | Trend |
|---|---|---|
| Higher Low | $167.32 | Up 2.02'% |
| Swing Low | $167.32 | Down 0.54'% |
| Bearish BOS | $167.32 | Down 0.52'% |
| All'Time High | $293.31 | Distant |
| All'Time Low | $0.500801 | Far |
- The Higher Low suggests a short'term rebound, but the Swing Low and BOS confirm a down'trend reversal.
- The bearish engulfing pattern corroborates the price structure, indicating a potential pullback or consolidation before a further decline.
Key Drivers
- Market Cap Momentum ' The decline below 3.690'trillion signals weakening institutional confidence.
- OBV Discrepancy ' Despite bullish volume today, the net OBV is negative, suggesting underlying selling pressure.
- Liquidity Surge ' A 6'% liquidity level means the market can absorb large orders, increasing the speed of price moves.
- Technical Break of Structure ' The BOS at $167.32 is a decisive bearish pivot that aligns with macro'scale bearish sentiment.
- Time'frame Disparity ' Weekly gains are offset by significant monthly and YTD losses, indicating a longer'term bearish bias.
Risk Factors
| Risk | Description | Mitigation |
|---|---|---|
| Volatility Spike | SOL can swing 5'10'% in minutes during news events. | Tight stop'loss at $170; use 2'3'% ATR. |
| Liquidity Gap | Rapid sell orders could cause slippage. | Order book monitoring; use limit orders for entry. |
| Macro'Fundamental Shift | Regulatory announcements or platform updates could reverse sentiment. | Monitor news feeds; exit position if fundamentals improve. |
| Model Drift | Data fusion models may under'predict if patterns shift. | Re'validate on next daily close. |
Actionable Trade Insight (Intraday)
Signal ' SHORT
Target ' $165.00 (approx. 1.2'% support, aligned with next higher low).
Stop'Loss ' $170.50 (above current swing high, 3'% above entry).
Trade Type ' Intraday (short'term) ' capitalize on the bearish break of structure before the market can recover.
Confidence Score ' 75 (nearly 80'% confidence based on convergence of volume, price, and market'cap momentum).
Call'to'Action
If you're looking to stay ahead of the curve in high'frequency crypto futures, join Auctron's exclusive analytics service. Unlock real'time alerts, precision'priced trade signals, and a community of data'driven traders. Don't let the next bearish breakout pass you by'subscribe now and secure your edge.
#SOLProfitPlay #SOLShortSignal