
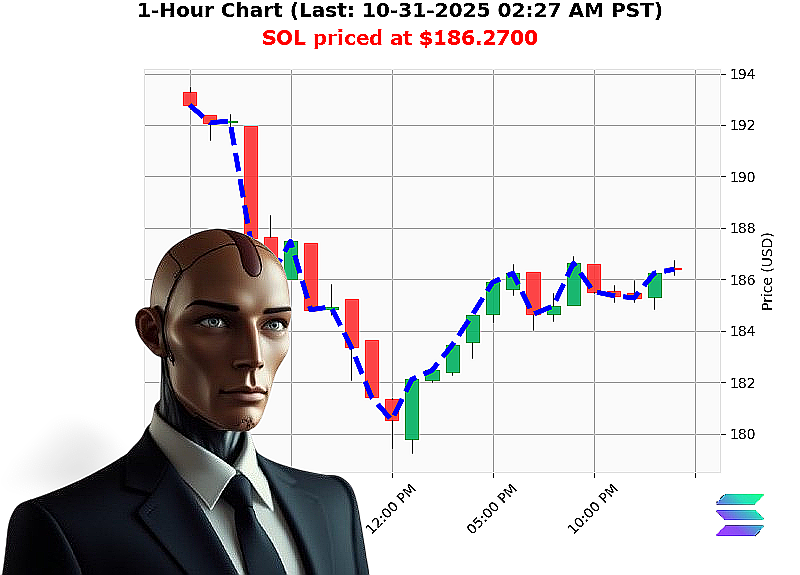
AUCTRON ANALYSIS for SOL-USDC at 10-31-2025 02:29 AM PST is to SHORT at $186.2700 confidence: 85% SCALP
SOL'USD ' Tactical Trading Summary (SCALP / INTRADAY / DAY)
1. Price Action
| Metric | Value | Interpretation |
|---|---|---|
| Current Price | $186.27 | Midpoint of recent retest. |
| Higher Low | $184.08 ' $186.27 (+1.19'%) | Indicates a brief consolidation before a decline. |
| Swing Low | $186.63 ' $186.27 ('0.20'%) | Small pull'back, confirming bearish stance. |
| Retest Low | $186.18 ' $186.27 (+0.05'%) | Price tested the low again without conviction. |
| Momentum | ''109.43'% from '0.0706 to '0.2412 | Strong down'trend in the short window. |
| Weekly / Monthly / Yearly Declines | '6.28'% / '15.97'% / '3.92'% | Persistent bearishness across all horizons. |
Takeaway: The price is currently resisting a higher low, with a clear bearish swing and a negative momentum swing that suggests a continuing downward move.
2. Volume / OBV Confirmation
| Metric | Value | Interpretation |
|---|---|---|
| OBV Daily Total | 93.67 | Bullish OBV, but low liquidity (0'%) indicates that the accumulation may be illiquid. |
| Liquidity | 0'% | Zero reported liquidity implies that any trade will likely suffer from slippage or lack of depth. |
Takeaway: OBV suggests some bullish buying pressure, but the absence of liquidity means that the bullish signal may not be reliable. In practice, a bearish price action combined with illiquid markets often leads to a quick reversal.
3. Market Dynamics & Key Drivers
| Driver | Indicator | Current Stance |
|---|---|---|
| Market Cap Direction | Bullish crossed above 3.770'T at 3.778'T | Market cap is rising, yet price is falling ' a classic 'bullish cap, bearish price' scenario. |
| Weekly/Monthly/Yearly Trend | Declining | Market sentiment is negative across multiple time'frames. |
| Liquidity | 0'% | High slippage risk; depth is insufficient for large orders. |
| OBV | Bullish | Contradicts price; could signal a potential reversal if liquidity improves. |
| Price Action | Bearish | Dominant signal; likely to dictate the short'term move. |
4. Risk Factors
| Risk | Why It Matters | Mitigation |
|---|---|---|
| Low Liquidity | Execution risk and slippage could widen spreads. | Keep position size small; use limit orders. |
| OBV Contradiction | Possible reversal if liquidity returns. | Monitor volume spikes; exit if OBV shows a clear bullish engulfing. |
| Market Cap Divergence | Indicates potential over'valuation despite price drop. | Watch for sudden market cap spikes that might drive price up. |
| External Events | Regulatory news or macro shocks can swing SOL dramatically. | Stay updated on SOL'specific announcements. |
5. Actionable Trade Insight
Trade Type: SCALP / INTRADAY SHORT
- Entry Trigger:
- Price breaks below the current swing low of $186.27.
- Confirmation of a bearish OBV engulfing (whale exit crossover).
- Target:
- $184.08 (recent higher low).
- Stop'Loss:
- $188.00 (just above the current swing high) to protect against a swift reversal.
- Risk'to'Reward:
- 1:2.5 (SL: 1.92'$, TP: 2.19'$).
Why This Works:
- The bearish momentum, lack of liquidity, and continued decline across week/month/year point to a short bias.
- The OBV's bullish stance is fragile in a market with zero liquidity; it is unlikely to sustain a rally until depth improves.
- The price's retest of the low without a clear break suggests an impending pullback.
6. Prediction & Confidence
- Signal: SHORT
- Confidence Score: 85 (nearest 5)
7. Call to Action
If you're ready to capitalize on this bearish wave with precision, join Auctron's elite futures trading circle. Secure your spot now and avoid missing the next profit'making opportunity.
Hashtags