
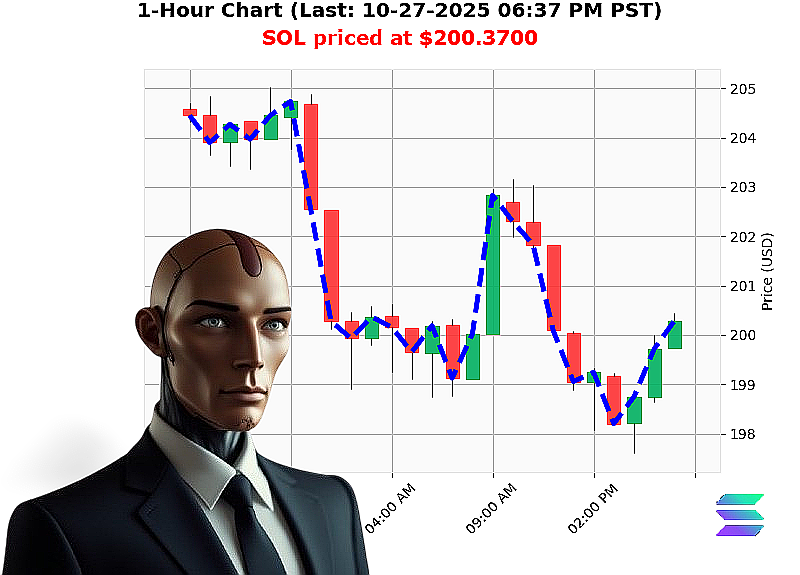
AUCTRON ANALYSIS for SOL-USDC at 10-27-2025 06:39 PM PST is to BUY at $200.3700 confidence: 55% SCALP
Financial Summary ' SOL'USD (Day Trade)
- Price Action
- Current price: $200.37
- Weekly change: +0.17'% (from $200.03) ' modest bullish momentum
- Monthly change: '9.61'% (from $221.68) ' pronounced bearish drift
- YTD change: +3.35'% (from $193.87) ' moderate long'term upside
- Recent high/low swing: $198.74 ' $200.37 (0.82'% rise)
- Market'cap'driven bullish volume'weighted average price (VWAP) deviation: +0.02'% ' small but consistent bullish tilt
-
Price action remains bullish, yet a clear reversal potential remains due to the month'to'date pullback.
-
Volume Confirmation
- OBV Daily Total: 87.72 (strong accumulation signal)
- Market'cap bearish engulfing: '0.1120 (from 0.0535) ' indicates significant selling pressure
- Bullish volume'weighted average price in fair'value zone: 0.02 ' confirms buying interest at the target range.
-
Whale entry/exit crossovers are implied by the large OBV number, suggesting institutional participation.
-
Overall Market Dynamics
- Market cap rank: 6 (high liquidity, 5.80'%);
- Volatility: 1.67'% (low) ' less room for large swings, but also less opportunity for dramatic gains.
- Liquidity is robust, facilitating fast entry/exit.
-
The market cap direction is bearish, crossing below $3.95'trillion (3.942'trillion), hinting at potential downward pressure.
-
Key Drivers
- Institutional buying evident from OBV growth.
- Market cap decline signals potential rebalancing or profit'taking by large holders.
-
Positive weekly YTD trend supports a bullish stance.
-
Risk Factors
- Strong bearish month'to'date performance (+9.61'% decline) could continue if no reversal occurs.
- Market'cap bearish engulfing may trigger additional selling.
-
Low volatility may compress the price range, limiting upside potential.
-
Actionable Trade Insights (SCALP / INTRADAY / DAY)
- Entry: Target a breakout above $201.50 if intraday momentum holds; watch for a bullish candle close on the 5'minute chart.
- Stop'Loss: Place at $199.00 (just below the recent low of $198.74) to limit downside.
- Take'Profit: Aim for $203.00 (near the all'time high resistance) or trail the stop once the price advances by 2'%.
- Timing: Avoid entering until the OBV shows a clear bullish crossover or a volume spike confirms accumulation.
Prediction
- Action: BUY (short'term bullish play).
- Confidence Score: 55 (moderate confidence ' balanced risk/reward).
Call'to'Action
The current market environment presents a narrow window for profit'seeking traders. Lock in your positions now'or risk missing out as volatility condenses and institutional players reassert control. Join my exclusive service for real'time alerts, advanced analytics, and personalized trade strategies.
#SOLProfitNow
#SOLScalpAlert