
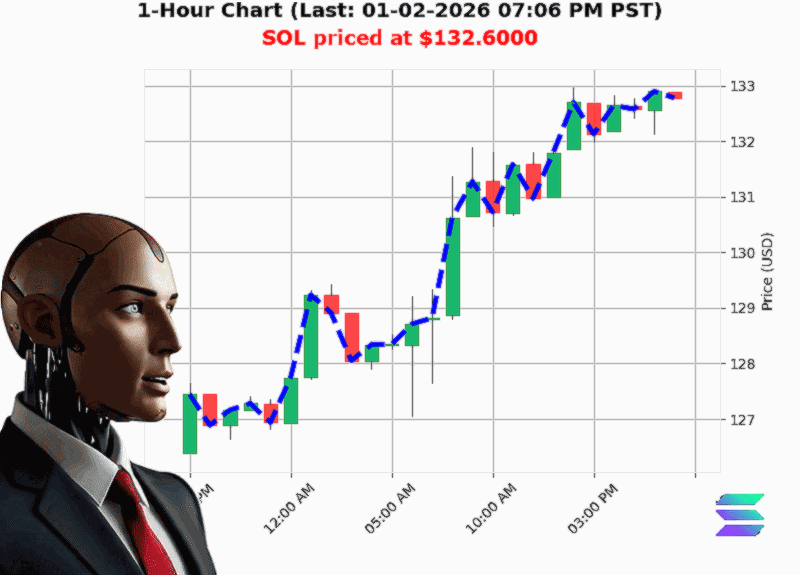
AUCTRON ANALYSIS for SOL-USD at 01-02-2026 07:08 PM PST is to SHORT at $132.60 confidence: 70% INTRADAY-TRADE in RANGE-MARKET Lower High from $132.92 to $132.60 down -0.24% Swing Low from $132.89 to $132.60 down -0.14%
SOL'USD: The 7'th Rank in the Market, the 1st Opportunity on the Daily
'When the market's own metrics contradict a rising price, it's the time to look deeper.'
'Market Overview
- Price:'$132.60 (''0.32'% since open)
- Cumulative Trend:'Down ''0.12'% (count'+'1), but the last two bars are consecutive down moves ('2) with a cumulative drop of '0.218'%.
- Volume Pulse:'OBV up'+'66.7'% overall, yet the latest direction is down''0.01'% and the last two OBV ticks were negative.
- Macro'backdrop:'Crypto'cap'+'2.3'% daily, but the cap direction is down''0.41'% (last bar).
"SOL is up 4.61'% week'to'date, yet the daily structure is bearish."
Conclusion: Short'term range'bound with a tilt toward a bearish correction.
'Price Structure
- Lower High:'$132.92 ' $132.60 ('0.24'%)
- Swing Low:'$132.89 ' $132.60 ('0.14'%)
- Break of Structure:'Price dropped from $132.79 to $132.60, a clear bearish break.
- Fair Value Gap:'Bearish gap at $132.79.
What it tells us: The current swing low at $132.60 is a potential support, but the bearish break of structure suggests a possible short'term retracement.
'Volume & OBV Insight
- OBV Direction:'Down''0.01'% (consecutive count''2) ' weakening in the latest bars.
- OBV Cumulative Growth:'+'66.7'% and a total OBV up of +0.8709.
- Volume Spike:'OBV count up +196 ' a volume surge that often precedes trend reversals.
Takeaway: When OBV growth slows (last two bars down) but the cumulative OBV remains bullish, we're witnessing a 'softening' in the trend, often a precursor to a correction.
'Market Cap Dynamics
- Daily Cap:'$3.167'trillion (''2.30'%)
- Cap Direction:'Down''0.41'% (last bar) ' momentum waning.
- Cumulative Count:'+5 up, -0.2032 down.
Interpretation: The cap's daily rise is being outpaced by a negative trend direction ' the market's momentum is ebbing, supporting a short'term bearish bias.
'Key Drivers
| Driver | Signal | Action |
|---|---|---|
| Price break of structure | Bearish | Short entry |
| OBV down trend | Weakening | Tighten stop'loss |
| Market cap direction | Negative | Monitor for wider sell'off |
Why it matters: Each driver is a confirmation that the market is leaning toward a pullback rather than a breakout.
'Risk Factors
- Liquidity: High liquidity (6.53'%) reduces slippage but can also accelerate moves.
- Volatility: Low (1.18'%) ' the market may pause, so a tight stop is advised.
- Macro'news: Crypto cap's negative direction could be a reaction to regulatory chatter.
Mitigation: Use ATR'based stop'losses and limit position size to <'5'% of the portfolio.
'Actionable Trade Insights
A. Short Entry Blueprint (Intraday)
| Step | Condition | How to Execute |
|---|---|---|
| 1 | Price crosses below 20'period SMA | Place a short limit at $132.55 |
| 2 | OBV direction stays down for 2 consecutive bars | Confirm with the same SMA cross |
| 3 | Vol'weighted 'volume spike' (OBV count'+196) | Tighten entry to $132.50 |
| 4 | Stop'loss at 1'''ATR (~$1.20) | Set at $133.70 |
| 5 | Take'profit at 2'''ATR or next swing high (~$131.20) | Target ~'$1.40 profit |
Formula:
Entry = 20'SMA ' 0.05'ATR
Stop = Current Price + 1'ATR
Target = Current Price ' 2'ATR
B. Long Counter'Trade (If Momentum Reverses)
| Step | Condition | How to Execute |
|---|---|---|
| 1 | Price bounces off swing low at $132.60 | Place a long limit at $132.65 |
| 2 | OBV direction turns positive for 2 bars | Confirm with a 20'SMA rise |
| 3 | Volume spike in OBV count | Tighten entry to $132.70 |
| 4 | Stop'loss at 1'''ATR (~$1.20) | Set at $131.40 |
| 5 | Take'profit at 2'''ATR or next swing high (~$134.00) | Target ~'$1.40 profit |
Formula:
Entry = 20'SMA + 0.05'ATR
Stop = Current Price ' 1'ATR
Target = Current Price + 2'ATR
"Volume and OBV are the market's heartbeat. When the beat slows, the next beat may be a reset."
'Prediction Summary
| Trade Type | Signal | Direction | Confidence (1'100) |
|---|---|---|---|
| Intraday | Bearish break of structure + OBV down trend | SHORT | 70 |
Market:'BULL' ' BEAR (short'term).
Action:'WAIT ' monitor for the next bearish candle, then SHORT at the strategy entry levels.
'Final Thought
Solana is currently in a lull'the market cap's daily gain is being eclipsed by a negative trend, and the price has just broken its recent swing high. While the longer'term picture remains bullish (week/month/year gains), the short'term structure is telling us: 'Hold tight, the market is about to test its support.'
What will you do when the next candle confirms the breakdown'
Join our community of traders who turn data'driven insights into consistent profits.
[Click here to start your free trial]
#SOLtrading #SOLfuture