
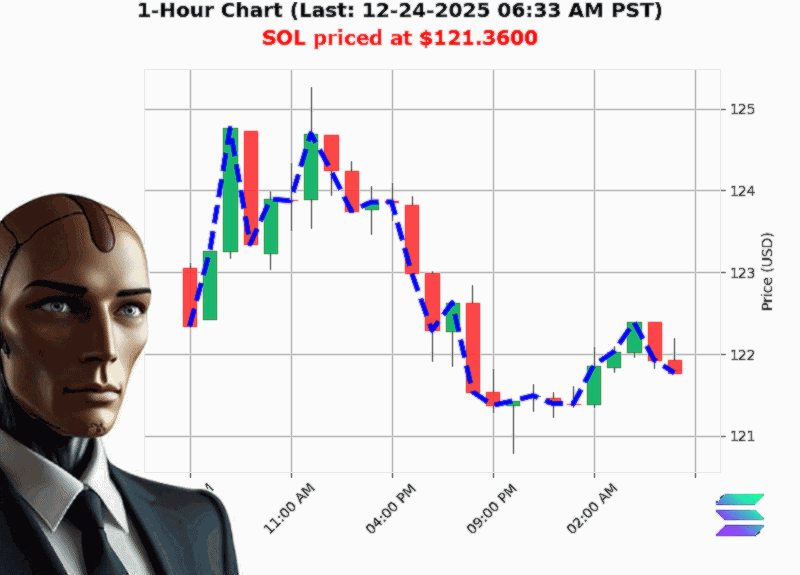
AUCTRON ANALYSIS for SOL-USD at 12-24-2025 06:36 AM PST is to BUY at $121.36 confidence: 70% INTRADAY-TRADE in RANGE-MARKET Higher Low from $120.82 to $121.36 up 0.45% Swing Low from $121.96 to $121.36 down -0.43%
Crypto Market Snapshot ' SOL'USD (12'24'2025 06:36'AM PST)
Price: $121.36' ' down 2.03'% from the open
OBV: down 14.44'% but rising streak of 20 bars
Market Cap: $3.029'T ' daily up 0.34'%
Structure: Bearish break of structure at 121.89 ' 121.36
What the Numbers Really Mean
| Metric | Current | Implication |
|---|---|---|
| Price trend | 6'day consecutive decline | Short'term bearish bias |
| OBV trend | 20'bar bullish streak, +3.69'% cumulative | Buyers are piling in despite the dip |
| Market cap | Slight daily upside | Broad'market positivity |
| Volatility | Low (1.37'%) | Trading in a tight corridor |
| Week/Month/YTD | Down 3.53'% / 4.22'% / 37.40'% | Long'term trend remains bearish |
Takeaway 1 ' The OBV Paradox
'OBV is up even though the price is down.'
The on'balance volume (OBV) is on a 20'bar up'trend, indicating that buying pressure is outweighing selling pressure, even as the price continues to fall. In a low'volatility, tight'range environment, this divergence is a classic 'reversal setup' signal. Traders often use OBV to spot early signs that the market is about to reverse a pullback.
Takeaway 2 ' A Bearish Break Doesn't Mean a Bear Market
The price broke its recent structure at 121.89, but the move is small ('0.43'%) and the break is shallow. In the context of a bullish OBV and a daily market'cap lift, the break looks more like a minor correction than a trend reversal.
Takeaway 3 ' Low Volatility = Opportunity
With volatility at just 1.37'%, the price is walking around a tight band. This makes it ideal for intraday or scalp strategies that can profit from short'term oscillations while avoiding the risk of a deep swing.
Takeaway 4 ' Volume'Weighted Momentum
OBV's cumulative rise of +3.69'% alongside a down'trend suggests that buyers are actively accumulating. A sudden drop in OBV would be a stronger bearish confirmation, but for now the evidence points to potential upside.
Takeaway 5 ' Market Cap Sentiment
Even though the overall market cap is slightly down for the day, the daily change of +0.34'% shows that the broader crypto ecosystem is still generating buying interest. This adds another layer of bullish bias to the SOL story.
Actionable Trade Insight
- Signal: BUY (long)
- Confidence Score: 70 (moderate'high, nearest 5)
- Trade Type: INTRADAY (scalp/short'term)
- Market Context: Range'Bullish (tight corridor, slight bullish tilt)
Why'
The OBV divergence, low volatility, and market'cap momentum suggest that SOL is poised for a quick rebound within the current range. A short position would risk missing this corrective move, whereas a long could capture the next upside leg before the price retraces again.
Forward'Looking Summary
The key question for traders is: Will the bullish OBV override the recent bearish structure'
If the price stays above the 121.36 pivot while OBV keeps rising, the next leg could take SOL toward the higher low at 121.36'''~123'.
If OBV stalls, you may face a sharper retracement.
Call'to'Action
Ready to ride the next move' Join our premium analytics service for real'time alerts, strategy backtesting, and a community of professional crypto traders. Don't miss the next wave'subscribe today.
Hashtags