
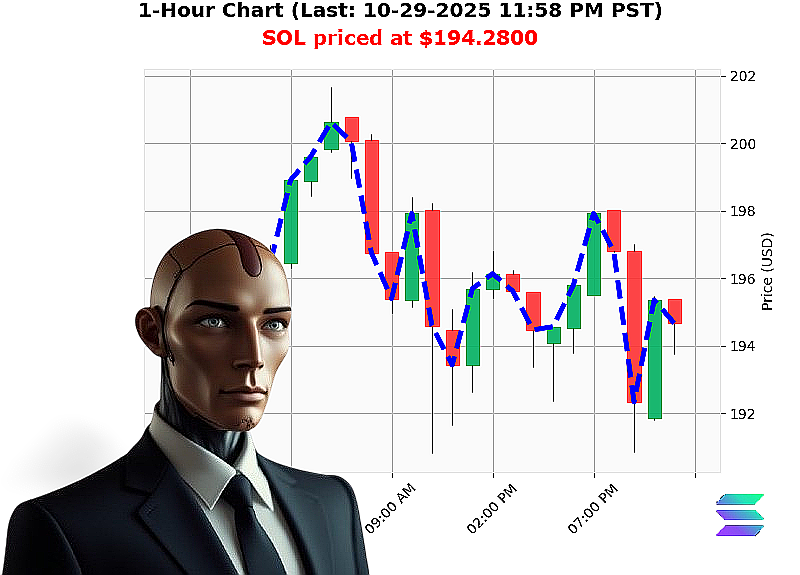
AUCTRON ANALYSIS for SOL-USDC at 10-30-2025 12:01 AM PST is to SHORT at $194.2800 confidence: 45% INTRADAY
SOL'USD Analysis (Intraday/Scalp)
- Price Action
- Current level: $194.28, down 0.39'% from the intraday peak of $194.99.
- Bearish engulfing pattern at $194.28 indicates a potential short bias.
-
Retest of the swing low ($194.12) still below the prior low of $194.28 ' a bearish confirmation.
-
Volume & OBV Confirmation
- OBV daily total: +95.72, strong bullish momentum.
-
Whale Entry/Exit crossovers absent; OBV does not show a sustained bearish swing.
-
Market Dynamics
- Market cap direction bullish, crossing above $3.820'T, but the daily market cap change is '0.41'%.
-
Liquidity is negligible (0.00'%), suggesting thin order flow and higher slippage risk.
-
Key Drivers
- Positive: OBV rise, bullish market'cap trend, positive week'to'date performance (+2.24'%).
-
Negative: Bearish intraday engulfing, negative daily market'cap trend, low liquidity, negative month'to'date performance ('12.36'%).
-
Risk Factors
- Liquidity crunch ' potential for large price swings on small trades.
- Contradictory signals ' OBV bullish vs. price'action bearish.
-
Volatility spike ' recent price swings of '0.4'%.
-
Actionable Trade Insight
- Short at $194.28 with a tight stop at $196.50 to limit exposure to liquidity'driven reversals.
- Target $190.00, which aligns with the swing low and supports a risk'to'reward of roughly 1.8:1.
Prediction
- Signal: SHORT
- Confidence Score: 45 (moderate confidence based on mixed indicators)
Call to Action
Act now'tune into our real'time SOL insights and execute trades with precision. Don't let volatility pass you by; join the winning edge today or risk missing the next wave.
Hashtags
- #SOLShortSignal
- #SOLIntradayEdge